Environment
Hiding in plain sight


An expedition to the Antarctic explores where rogue waves begin, and what these monsters tell us about the way the ocean behaves and interacts with global climate change
Published 14 September 2017
Over the past 20 years, research has confirmed an increase in wind speeds and wave heights in our oceans - and it’s our planet’s most extreme locations that offer more information about how this is affecting the global climate.
University of Melbourne ocean engineer, Associate Professor Alessandro Toffoli, recently returned from an expedition to the Antarctic where waves and ocean conditions are the most extreme. Studying waves here provides scientists with the most comprehensive data on earth.

The reason for this is that strong winds and waves drive the exchange of heat and gas between the atmosphere and the ocean - contributing to the energy balance of the planet. At very high latitudes, waves interact with sea ice, and it’s this ice that plays a crucial role in our climate system.
In addition to acting as the planet’s refrigerator, the ice’s bright surface also reflects solar heat, which would otherwise be absorbed by the dark ocean. Additionally, salt left behind in the ocean by the freezing process drives large-scale currents, which transports cold water towards the equator and guides our weather patterns.
One of the most visible impacts of climate change is ice shrinking in the Arctic, and scientists are working to understand how this impacts our climate. Key to this is understanding how waves behave, interact with, and erode sea ice, and feeding this data into global climate models. As sea ice melts, there are greater distances of open ocean that increasingly stronger winds blow across, generating waves. As these waves build they accumulate more energy, slamming against the ice and breaking more pieces off.
And it becomes a loop of ice erosion - less ice increases the distances over which wind and waves can build, causing further erosion and so on.
Environment
Hiding in plain sight
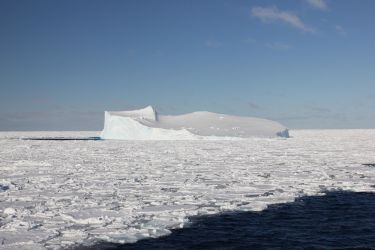
Although the Antarctic ice isn’t shrinking, it’s geographically where waves and ocean conditions are most extreme on Earth. A study spanning twenty years has shown that wind speeds there have increased around ten per cent and extreme wave heights around six to seven per cent. The tallest waves carrying the most energy are found off the southern coast of Australia, and now peak between five and six metres.
To put this in the context of studying global climate change, Associate Professor Toffoli kept a diary of his time in the Antarctic where wind and waves converge with sea ice.
We set sail from Cape Town, the South African gateway to the Antarctic, at about 15:00 local time. Just outside the harbour, the sea starts to swell… it is now dark outside and the sea is worsening a bit. Very few people show up for dinner… it will be a rough night as we begin to sail the fiercest ocean on the planet.
Rogue waves were believed to be a sailor’s myth for centuries, and little is known about them, especially in the Southern Ocean. But we now have evidence that they are causing an increasing number of marine accidents. So part of our focus is working on the ability to forecast them more accurately.
As wind speeds and wave heights in the Southern Ocean are increasing, rogue wave encounters are becoming more frequent. These waves are monstrously steep, usually occur without warning and cause the most damage. Compared to the Arctic, the extraordinary environment of the Southern Ocean provides a nursery for monster waves to grow.
But unlike the Arctic Circle which is intersected with land masses, the Southern Ocean is uninterrupted, allowing wind to blow infinitely and creating an unlimited ‘fetch’, which is an area of ocean surface over which the wind blows in an essentially constant direction. Rogue waves can reach record heights of 26 to 30 metres – that’s around six double decker buses stacked on top one another.
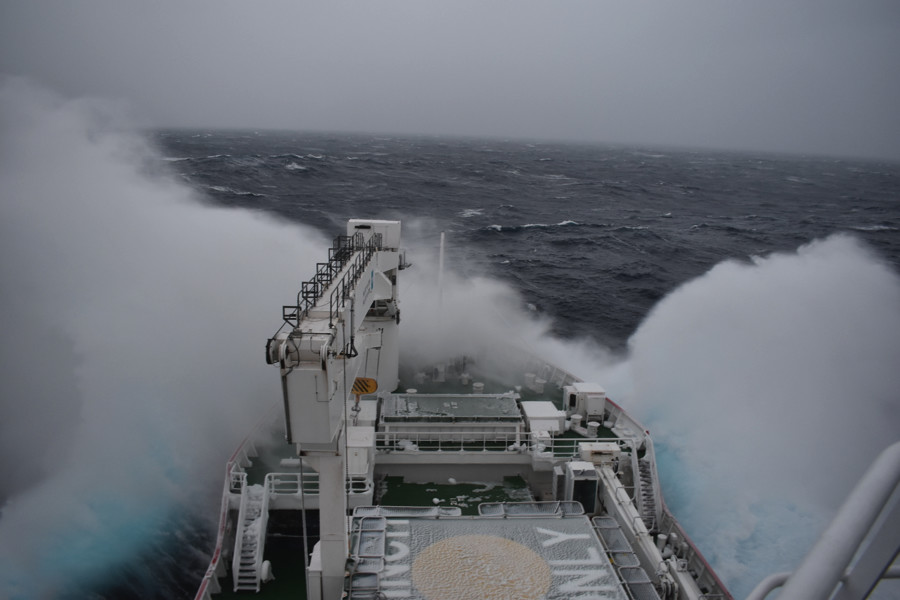
We are rapidly moving towards 40 degrees South, where we expect to face ferocious winds, the so-called Roaring Forties. Over the day, the voyage is fine and the ship motion is kept to a minimum. At dusk, winds increase as we approach the 40s. Wind speeds are so strong it’s hard to balance if we do not hold on properly… the ship is shaking hard. These are perfect conditions to measure extreme waves.
The Roaring Forties describes the ‘roaring’ wind speeds experienced 40 degrees south of the equator. As a result of the interaction between warm equatorial air rising, and the Earth’s shape and spin, wind speeds get faster the closer you get to the poles. At latitudes of 50 and 60 degrees south, wind speeds blow constantly over 50 kilometres per hour and are referred to as the Furious Fifties and Screaming Sixties.
The majority of the existing wave data is collected from buoys peppering the North Sea, Atlantic Ocean and Gulf of Mexico as a result of the abundant shipping routes and oil fields that require monitoring. Data from the Southern Ocean is scarce, so part of this expedition is measuring these giant waves and the three-dimensional surface of the ocean using stereography.

A stereographic system consists of two, synchronised cameras capturing overlapping fields of view of the ocean. Similar to how our brain marries both images and uses the subtle differences to generate depth perception, computers are able to reconstruct the three dimensionality of the ocean surface using the videos.
Observations of the ocean surface allow us to identify the fundamental mechanisms that control the generation of extreme and rogue waves and understand how often they can be expected.
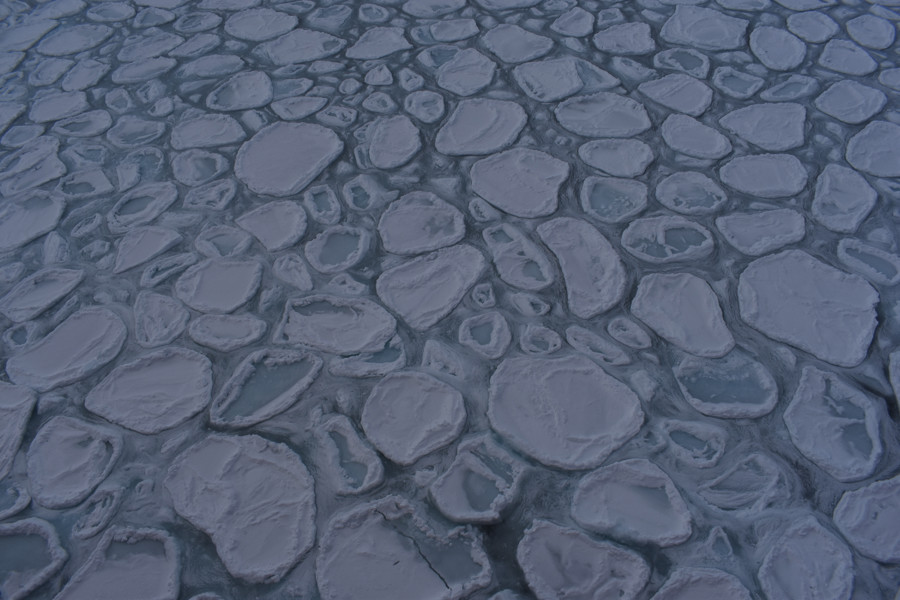
After a long journey, we finally reached the sea ice at 61.5 degrees South. Normally, we would expect to encounter ice much earlier on the journey at the beginning of the winter, but the ice edge for this part of the ocean has retreated. This is the very beginning of sea ice and it forms in the shape of a pancake. Swells are six to eight metres high. It is spectacular. For hours the wind has averaged 72 kilometres per hour and it’s difficult to stay outside. But we manage to deploy a buoy and video waves in the ice. We also deploy five GPS trackers to monitor the movement of the pancakes.
Pancake ice describes a type of round ice, like floating dinner plates ranging from 30 centimetres to three metres wide. These ice formations mark the marginal ice zone – a dynamic and transitionary zone separating the open ocean where waves freely propagate, from the flat, white desert of compact ice. The marginal ice zone also shields the compact ice, tempering the waves attempting to penetrate and crash into it.
By monitoring the movement of the pancakes with trackers and videos, we are able to gauge the height of the waves propagating through sea ice and track their movement until the pancakes merge and freeze together forming part of the larger, compact ice. These trackers offer crucial information as to how the marginal ice zone migrates under the effect of wind, waves and current.
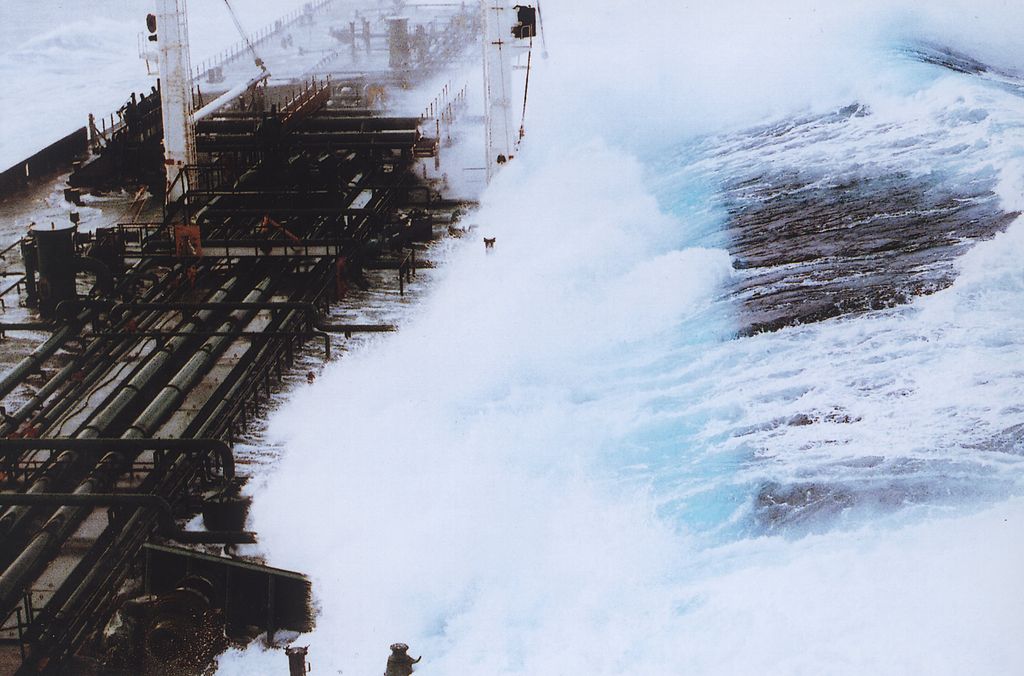
The time spent on the sea ice was short but intense. We conducted a lot of research. Apart from looking at waves, we deployed buoys and took water samples. We are now outside the sea ice and the storm is still blowing. The waves are enormous. The ship climbs these waves very slowly, but it doesn’t feel like we’re moving forward. Looking out from ‘Monkey Island’ – the top deck of the ship - I can see a wall of water coming towards us. The ship is about 30 metres tall, but these waves must be at least 20 metres high.
As waves generated by the Screaming Sixties encounter the sea ice, some of their energy dissipates and only a fraction of their power penetrates the ice.
Although their energy is dampened, those waves that penetrate the ice can still travel for hundreds of kilometres, confirming our observations in the laboratory.
The physics behind wave propagation during storms is still not well understood which is why expeditions to Antarctica are such invaluable opportunities. Data collected from southern-most latitudes encapsulates the full range of global conditions; and this will help inform wave-ice models in predicting how the polar ice edges behave, which is fundamental to improving climate models.
Understanding environments like the Antarctic helps further our knowledge about the way the ocean behaves and interacts with the global climate, and that is something that will be crucial to our future.
Banner image: NOAA Banner video: Supplied
