How researchers are keeping your health data safe

Researchers developing an Australian heatwave index are using innovative data collection that improves the quality and resolution of personal data while protecting people’s privacy
Published 28 November 2024
Heatwaves are Australia’s deadliest natural disaster, causing more deaths than any other natural hazard. The intensity and frequency of heatwaves are predicted to increase due to climate change, posing great risks to human health – especially in cities where the urban heat island effect can exacerbate these impacts.
For this reason, many cities including the City of Melbourne, have appointed Chief Heat Officers to assess and mitigate such risks.

A critical element in understanding these effects – and how to mitigate them – is access to relevant data.
However, this can often be a difficult process due to the disparate sources of such data, the variety of scales at which this information is collected, and the need for privacy when dealing with health data.
Most people would agree that understanding heatwaves at a local scale is important and worthy of research, but most Australians unfortunately have personal experience with data breaches and many would be reticent if they thought their personal information, including health information was in any way at risk.
A problem of scale
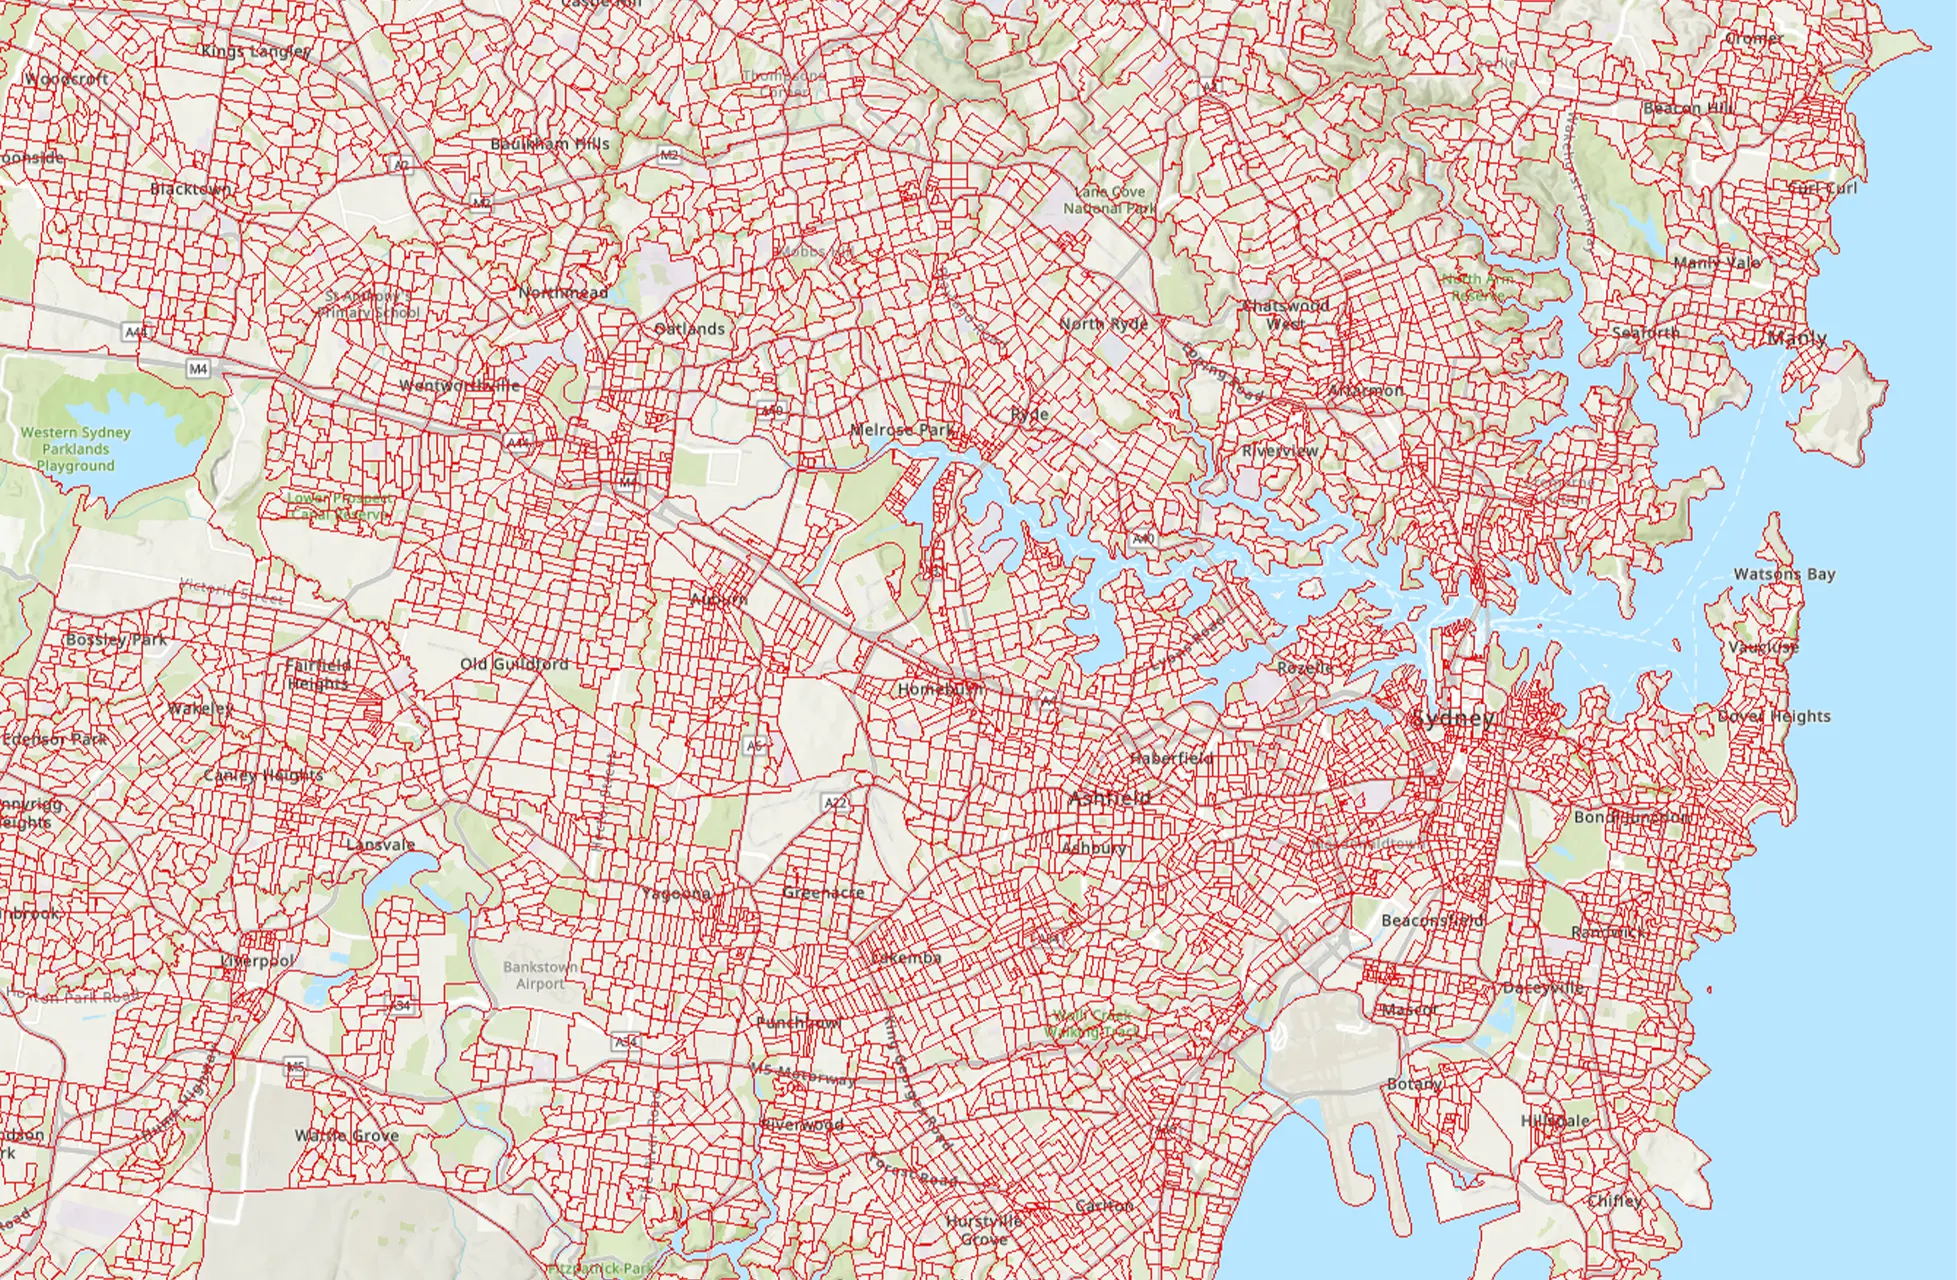
Typically, geospatial data is available at different scales based on Statistical Areas, as defined by the Australian Bureau of Statistics. Statistical Area Level 1 (SA1) is one of the smallest possible levels.
Australia is covered by 61,845 SA1 regions with an average population of 400 people.

The same heatwave can affect populations disproportionately depending on their health, demographic and socioeconomic status, as well as the built and natural environment of their local area.
Having access to SA1 level data would allow for detailed, high-resolution analysis which is essential for our research. However, existing indicators primarily focus on heat vulnerability at the broader SA2 level (average population 10,000).
At this scale, population and urban characteristics are averaged out over large geographic areas and so we are potentially missing out on important details, like the specific drivers contributing to vulnerability profiles.
But there’s a flipside.
These larger areas are more often used because of the risks related to accessing and analysing health data. All of the health data used in studies like ours is de-identified, but at the smaller SA1 scale, there is a real possibility that individuals could be re-identified and their personal information compromised.

For example, in an SA1 area there might be only one or two people with a particular health condition, making it possible, when linked to other data, to identify these people.
We are working with government to develop and share ways to use high-resolution health data in a completely safe way.
Heat Health Vulnerability
Currently, we're developing a Heat Health Vulnerability Indicator (HHVI) as part of the Australian Urban Health Indicators (AusUrb-HI) pilot project, a collaboration across National Collaborative Research Infrastructure Facilities – AURIN, PHRN and ARDC – as well as Queensland University of Technology, RMIT University, the University of Western Australia and Cancer Council Queensland.
The HHVI aims to support government agencies in obtaining a comprehensive understanding of heat vulnerability at a local scale, allowing them to direct resources where they are needed (for example, to cope with a spike in hospital presentations during a heatwave), allocate resources for vulnerable populations and take targeted planning measures towards urban heat resilience.

Health & Medicine
Medibank’s hack tells us privacy laws need to change
The HHVI identifies spatial patterns of vulnerability, as well as underlying health, socioeconomic and urban environment characteristics with the potential to increase both vulnerability and exposure to heat.
To uncover these factors, we use health data in conjunction with population data (eg age, socioeconomic disadvantage, household composition, education, income), urban data (eg building height and density, public transport, water and green space) and environmental data (eg temperature).
We use this data to create three sub-indicators which together provide an indication of heat health vulnerability: heat exposure, sensitivity and adaptive capacity.
Using New South Wales (NSW) as a case study, we have identified and compared these sub-indicators over space and time and assessed surges in demand for health and emergency services related to heatwave intensity.
One notable preliminary finding was that inner regional areas experienced lower vulnerability, on average, than major city areas and this difference appears to be caused almost entirely by a consistent increase in heat exposure in these major city areas.

Risk and reward
An essential part of this project involved finding ways to unlock access to data which can often be difficult to obtain because of privacy concerns.
The steps involved in mitigating privacy risks depends on the type of data and is different for each Australian state.
For example, in NSW, government health data is held by data custodians. Once our research application was approved, data was linked by the Centre for Health Record Linkage, then transferred to a Secure Unified Research Environment (SURE).
We are never handed data directly to store and analyse on our own computers; instead, we access and process data inside the secured environment provided for the project. Data custodians have access to the project space and review and approve any results before they can be extracted from SURE.
Researchers undergo a lengthy and detailed application process that requires specific training and approval from several data custodians, as well as an independent ethics committee.

Health & Medicine
Our mental health has gone digital
We undertake a risk assessment to test for potential weak points and determine appropriate analysis methods to prevent individuals from being re-identified.
As you can see, the process of accessing health data is highly complex and requires ongoing communication with all parties involved.
We’ve been documenting this process to create a clear pathway for future researchers to successfully access linked health data, without putting patient data at risk of re-identification.
We hope sharing our process will help the wider research community understand the necessary steps to safely access and analyse highly sensitive data.
We also hope the HHVI itself will allow researchers to refine and adapt the indicator for further environmental health research to support community adaption and resilience in the face of growing health and climate challenges.

