Health & Medicine
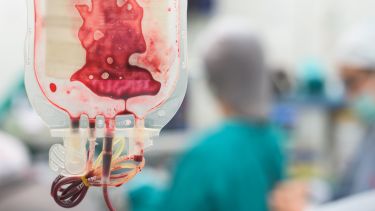
Saving lives with less blood


Combining laser imaging with supercomputing, researchers are modelling the severity of artery blockages without physically probing the blood flow, and may be able to identify future danger areas
Published 14 November 2017
In the near future, heart specialists will be using virtual devices based on mathematics and supercomputing to predict artery blockages before they happen.
Cardiologists already have an armoury of catheter-mounted tools they use to probe blockages in our arteries, from tiny cameras that read injected dyes, to lasers that produce high-resolution 3D images.

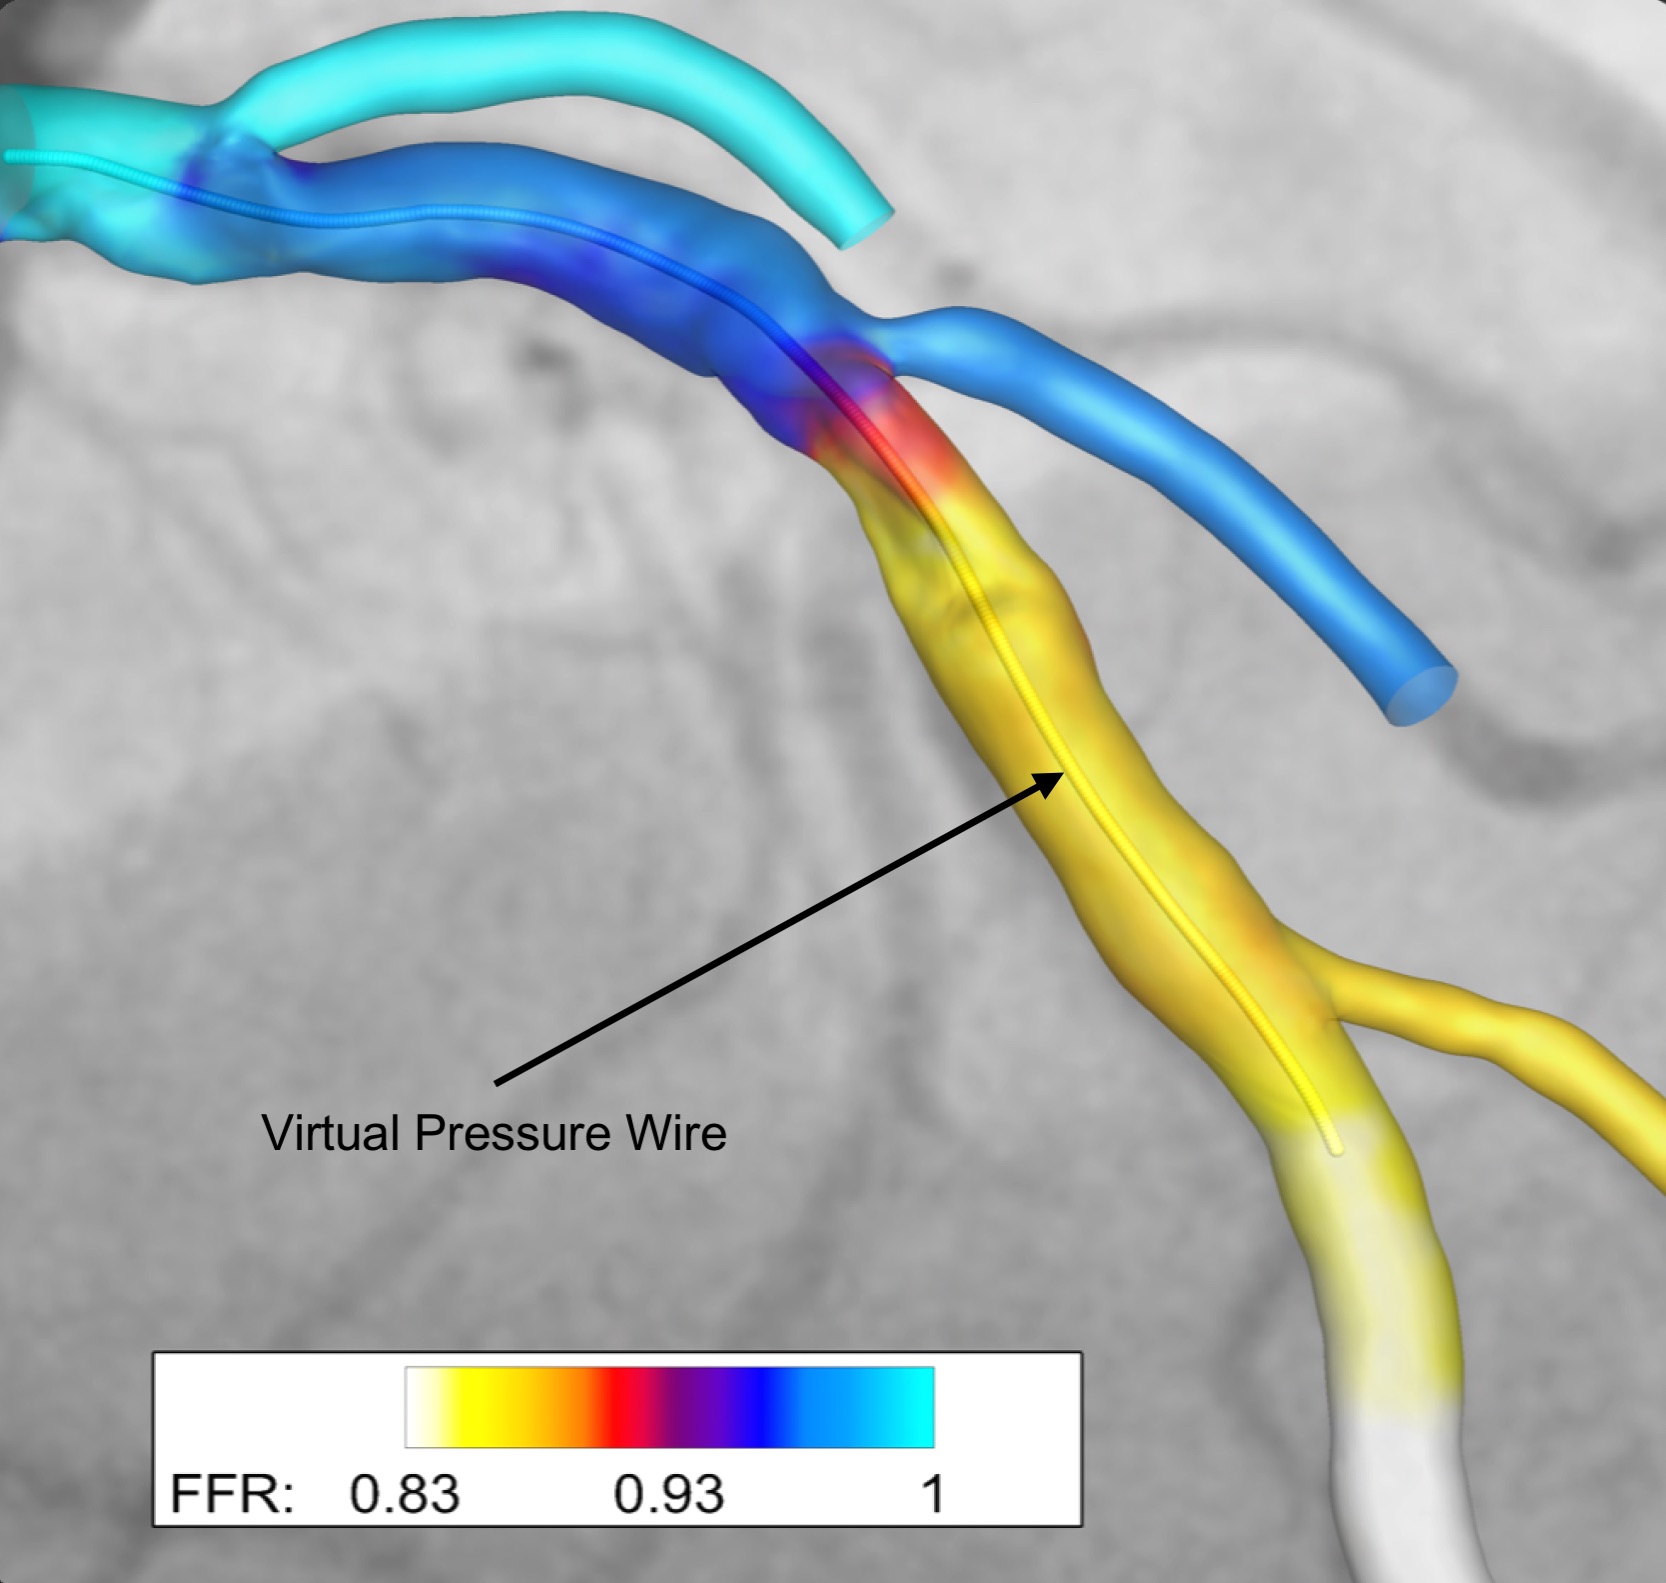
But researchers at the University of Melbourne have now used mathematical modelling to successfully calculate how badly a blockage is impeding the flow of blood, using the images already gathered from catheters regularly inserted into arteries. It replaces the need for inserting a physical pressure wire into an artery to measure blood pressure loss around a blockage.
Using maths as a “virtual pressure wire” like this isn’t new, but it is the first time it has been used in conjunction with high-resolution laser imaging taken from inside an artery, making it potentially much more accurate than previous modelling. The resulting highly detailed information also opens the way for using this modelling to prevent blockages in the first place, by assessing whether the shape of an artery makes it prone to fat and cholesterol build up. It could also be used to model the precise type of stent that is best suited to clearing a blockage.
“Arteries are very complicated geometrically, but if we can model how that affects fluid flow and turbulence within them we can then identify places where the fluid is slowing and is therefore at higher risk of developing blockages from deposited fats, cholesterol and calcium,” says Professor Peter Barlis, cardiologist and academic researcher based at St Vincent’s Hospital Melbourne, Northern Health, and the University of Melbourne.
“That could allow us to predict where patients may develop problems in the future and intervene early with perhaps medication or new therapies that can prevent future deterioration and complications.”
Previous mathematical modelling of blood flow has been based on using data gathered from an angiogram – an x-ray procedure that looks closely at coronary arteries for narrowing or blockages. This involves injecting dye into the patient’s arteries to highlight the shape of the vessels. However, an angiogram produces only a 2D image, providing little to no information about surface variations inside the artery and its complex geometries.
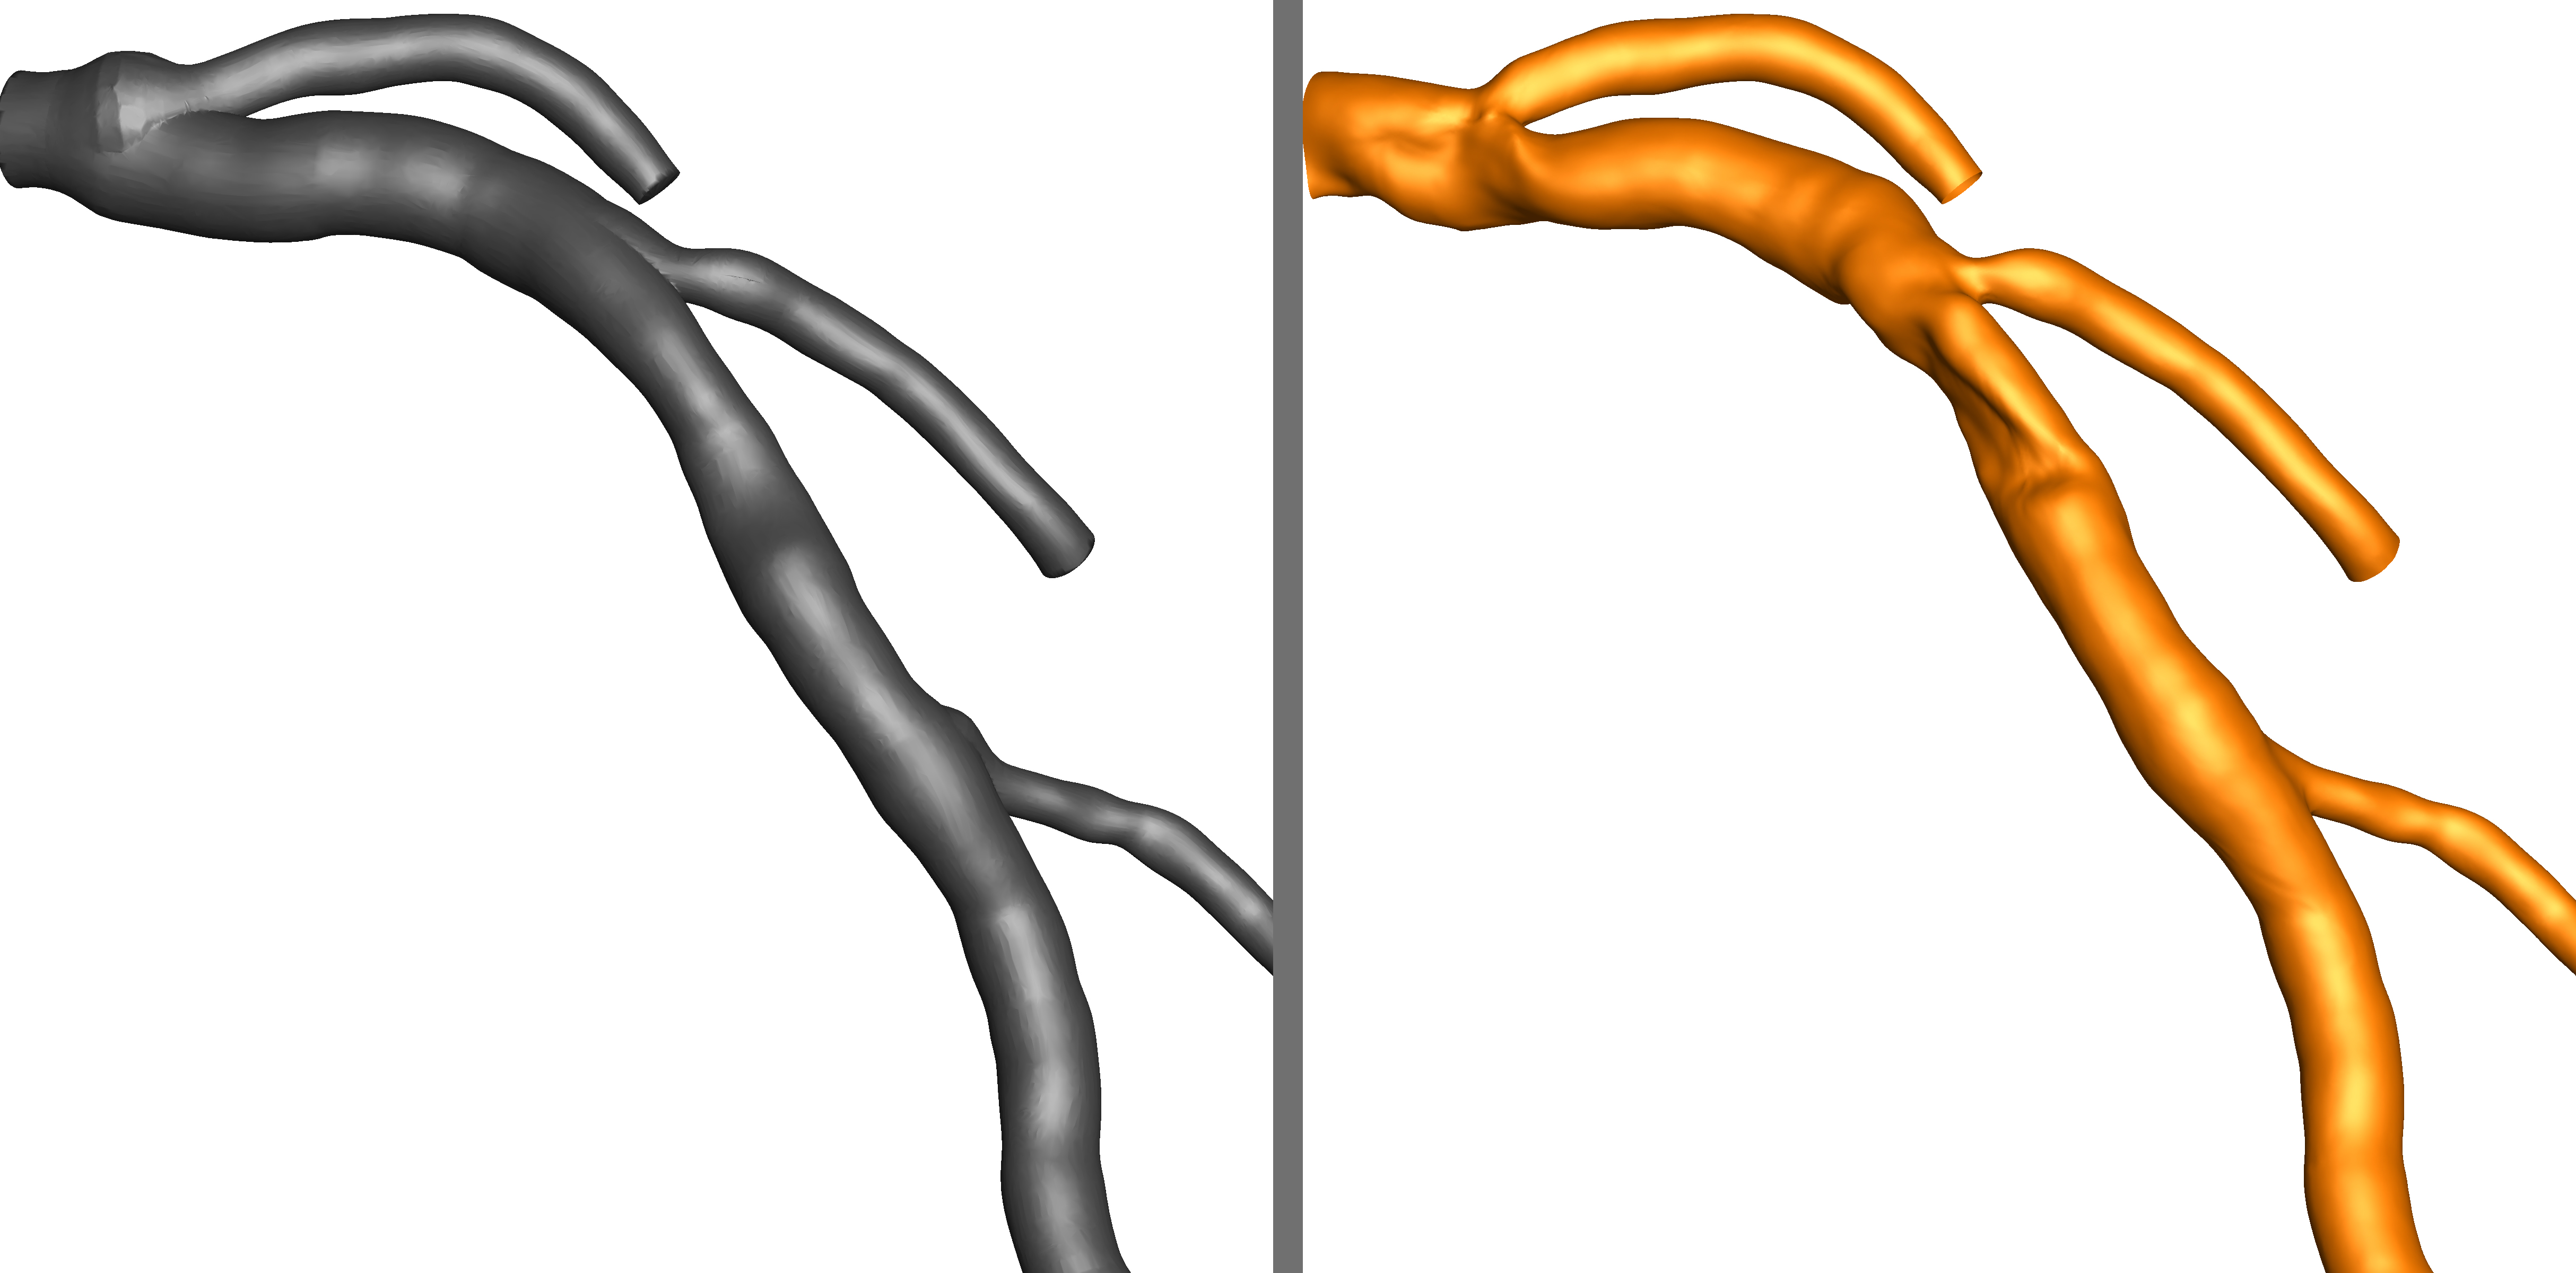
University of Melbourne engineers Professor Andrew Ooi, Dr Eric Poon and Dr Vikas Thondapu have now used high resolution laser data from catheter-mounted optical coherence tomography (OCT), combined with angiogram data to successfully model blood flow in a section of an artery. The results are published in the European Heart Journal.

“By meshing the two data sets together we can image all the nooks and crannies of an artery that can have an influence on blood flow, but these would have been unseen if we’d just used angiogram data,” says Dr Thondapu, a medical doctor-turned engineering researcher.
To model the section of artery the engineers processed over 350 images of cross sections taken 0.1mm apart. The tiny gap between each cross section then had to be filled in with extrapolation based on a computer program they spent six months creating and refining.
All this data was then fed into the Pawsey Super Computing Centre in Western Australia. It took over two days to compute all the data and create the accurate “virtual pressure wire.”
Measuring the blood flow around a blockage is important because it is a critical indicator of whether a cardiologist needs to intervene, rather than treat a patient with medication. If a blockage is reducing blood pressure in the artery by 20 per cent or more then doctors will usually intervene by inserting a stent to expand an artery.
“The imaging we gather is very good at allowing us to assess a blockage, but in some cases it can’t tell us whether the blockage is serious enough to need a stent. In those cases, we have to rely on measuring the blood flow, and that generally means using another invasive procedure and inserting a pressure wire,” says Professor Barlis.
But using the mathematical model and supercomputers, the team were able to calculate that an artery blockage in a participating patient was reducing blood pressure in the region of the blockage by 15 per cent, indicating that surgery wasn’t necessary. When Professor Barlis used an actual pressure wire to measure the flow he had a similar reading of 17 per cent. A larger trial will now be needed to confirm the accuracy of the modelling.
Health & Medicine
Saving lives with less blood
There’s also a cost benefit. Each catheter insertion costs around $1,500, meaning that a “virtual pressure wire” could significantly reduce the cost of dealing with blockages where it is unclear whether surgery is needed.
Professor Barlis says the technology could also be used to mathematically model the effect of different stents before they are inserted, telling cardiologists exactly what sort of stent is needed and by how much it should expand an artery. If a stent isn’t expanded enough it won’t be doing its job, but if it is expanded too much it can risk damaging the artery.
“This technique has a role to play in better assessing coronary artery disease generally, whether it be assessing blood flow, mapping arteries for risk, or optimising the size of stents,” says Professor Barlis.
While the application of the technology needs a supercomputer, Dr Poon says that as computing power continues to speed up it should be possible in the near future to produce a clinic-based platform that could readily crunch the data.
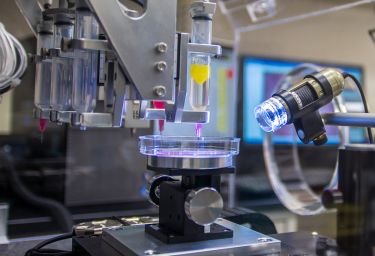
Health & Medicine
Five ways 3D printing is changing medicine
“The human body is one the most complex systems on earth from an engineering point of view and that is why it is so challenging to create models of the body - they require so much computing power,” says Dr Poon.
“But given the way computing power is becoming faster and faster, I think it is clearly feasible that we could have a cloud-based computing platform on a cardiologist’s desk into which they could feed the data and obtain timely results back to enhance the clinical decision making process.”
Banner image: Imaging taken from inside an artery using catheter-mounted optical coherence tomography that uses laser light to accurately image the complex structures often found inside arteries.
Banner image: Supplied


