Sciences & Technology
Prove it – with maths


From COVID to mortgage rates, we see data presented in graphs all the time, but our interpretation can differ – a lot

Published 8 August 2024
What do you see when you look at this graph?
There are a series of points rising from left to right.
If you had to describe this graph, you’d likely say something like, ‘as the horizontal (x-axis) values increase, the vertical (y-axis) values also increase’.
If I tell you that the graph shows average heights and weights you would then say ‘as height goes up, so does weight’.
Now, imagine that a line traces this relationship between height and weight.
You are probably thinking of a straight line which closely follows most of the points.
But if you look closely, these points do not make a perfectly straight line.
The dots seem to bend a little and you might get a better ‘fit’ by using a curved line.
The above graph is called a scatterplot, and by some counts, scatterplots make up about 80 per cent of all scientific graphs.
You may have seen them in the media – during elections they’ll tell us about voting trends over time; in business, they can tell us about the stock market; or, if you think back to COVID, they were used to tell us about infection rates and fatalities.
A statistical technique called linear regression provides a simple and accurate method to estimate a straight line (or linear function) through a scatterplot.
But even without statistical techniques, most people could make a good approximation by simply drawing a line on the graph.
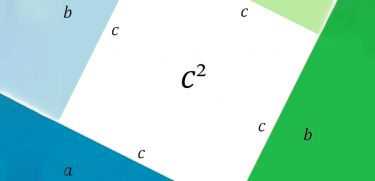
For the curved line, again we can use a statistical regression technique to estimate the parameters of the line using a more complex quadratic function which describes a curve with one bend or elbow point.
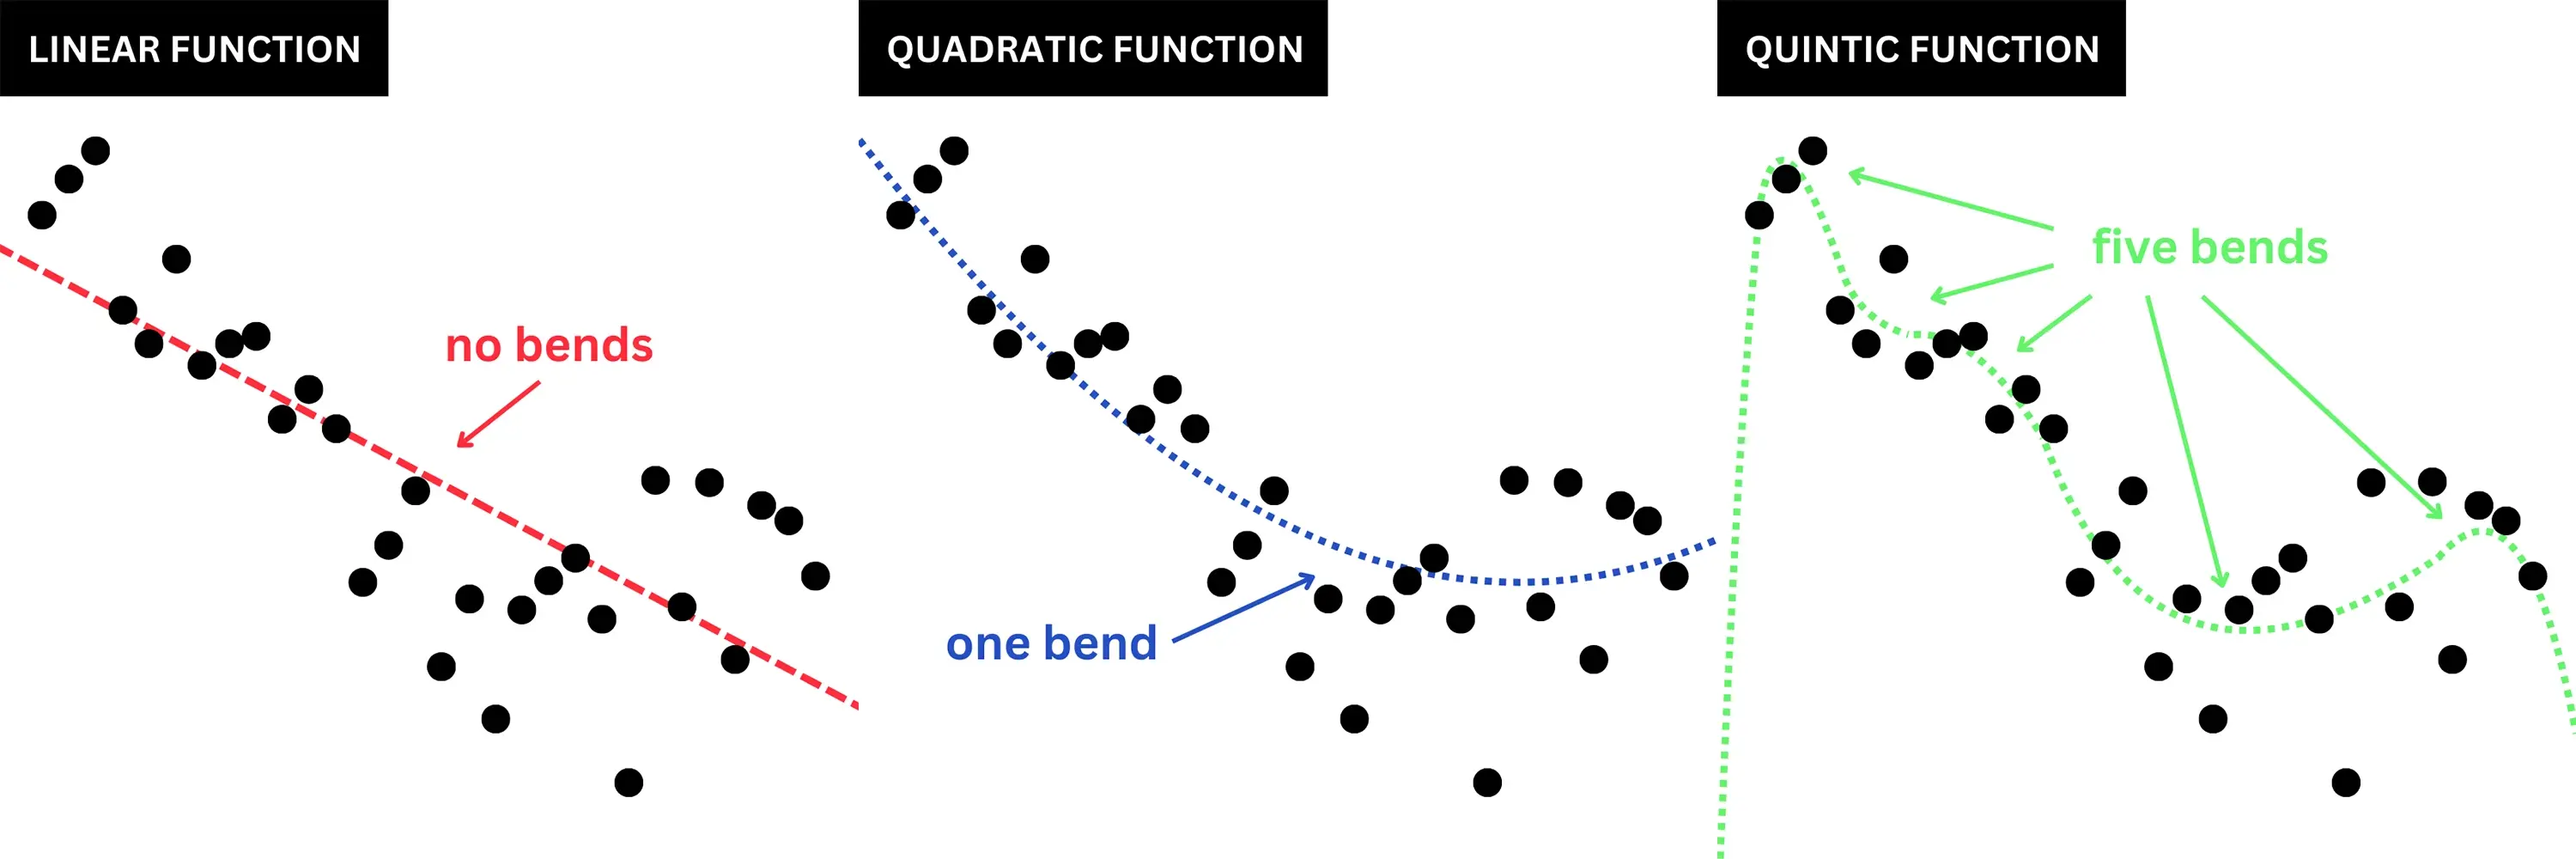
Linear and quadratic functions come from the family of polynomial functions that get increasingly complex depending on the number of bends in the line.
Linear functions have no bends, quadratic functions have one, cubic functions have two, and so on.
Sciences & Technology
Prove it – with maths
Drawing lines through the data – or plotting lines using statistical regression – allows you to infer some important new information.
For one, it allows you to extrapolate to new values beyond the minimum and maximum points in the graph – for example, you could estimate the average weight of someone who is two metres tall.
It also allows you to interpolate by predicting the values between the data points.
But here’s the problem – different lines lead to different inferences.
The height-and-weight graph above looks straight and neat but this is only because the weight of many people at each height has been averaged together.
Most data sets and scatterplots are more ‘noisy’ – that is, they contain variabilities which makes the line that best describes the relationship between the x and y values harder to see.
In science, when we are looking to explain data, we tend to prefer functions which balance ‘fit’ (that is, how closely the line approximates the data) and ‘complexity’ (the polynomial degree – or bendiness – of the line).
More complex polynomials may look like they fit the data better but the extra complexity comes at a cost.
A complex function that ‘overfits’ the noise in the data might not provide a good prediction for any new data.
Got that? Well, here is a graph of heights and weights that shows data from individuals rather than groups of people.
Let's take a look at another graph.
Because the data is ‘noisier’, visualising a line (or function) which describes the data is more difficult.
If you work with graphs on a regular basis or have been trained in statistics, then you might default to assuming a very simple straight-line relationship.
But our brains have a tendency to try to connect nearby points into solid curves and contours.
Graphs are multidimensional visual objects – that is, they contain a lot of visual information – so our visual biases and perceptual illusions can lead to distortions in how we interpret a graph.
In our recent study, we asked 180 psychology students, with varied mathematical backgrounds, to look at scatterplots like the one above and draw a line that best ‘fits’ the data.
Some of the scatterplots had a small amount of data and others had a lot. In some, the data took up most of the graph, while in others, the data was concentrated in the middle.
We also varied the true mathematical function which generated the data. We generated scatterplots from straight (linear) functions, one curve (quadratic) functions, and from functions that form two curves (cubic).
Importantly, noise was added to all the graphs to obscure its true function.
Have a look at some of the example scatterplots we presented to the students.
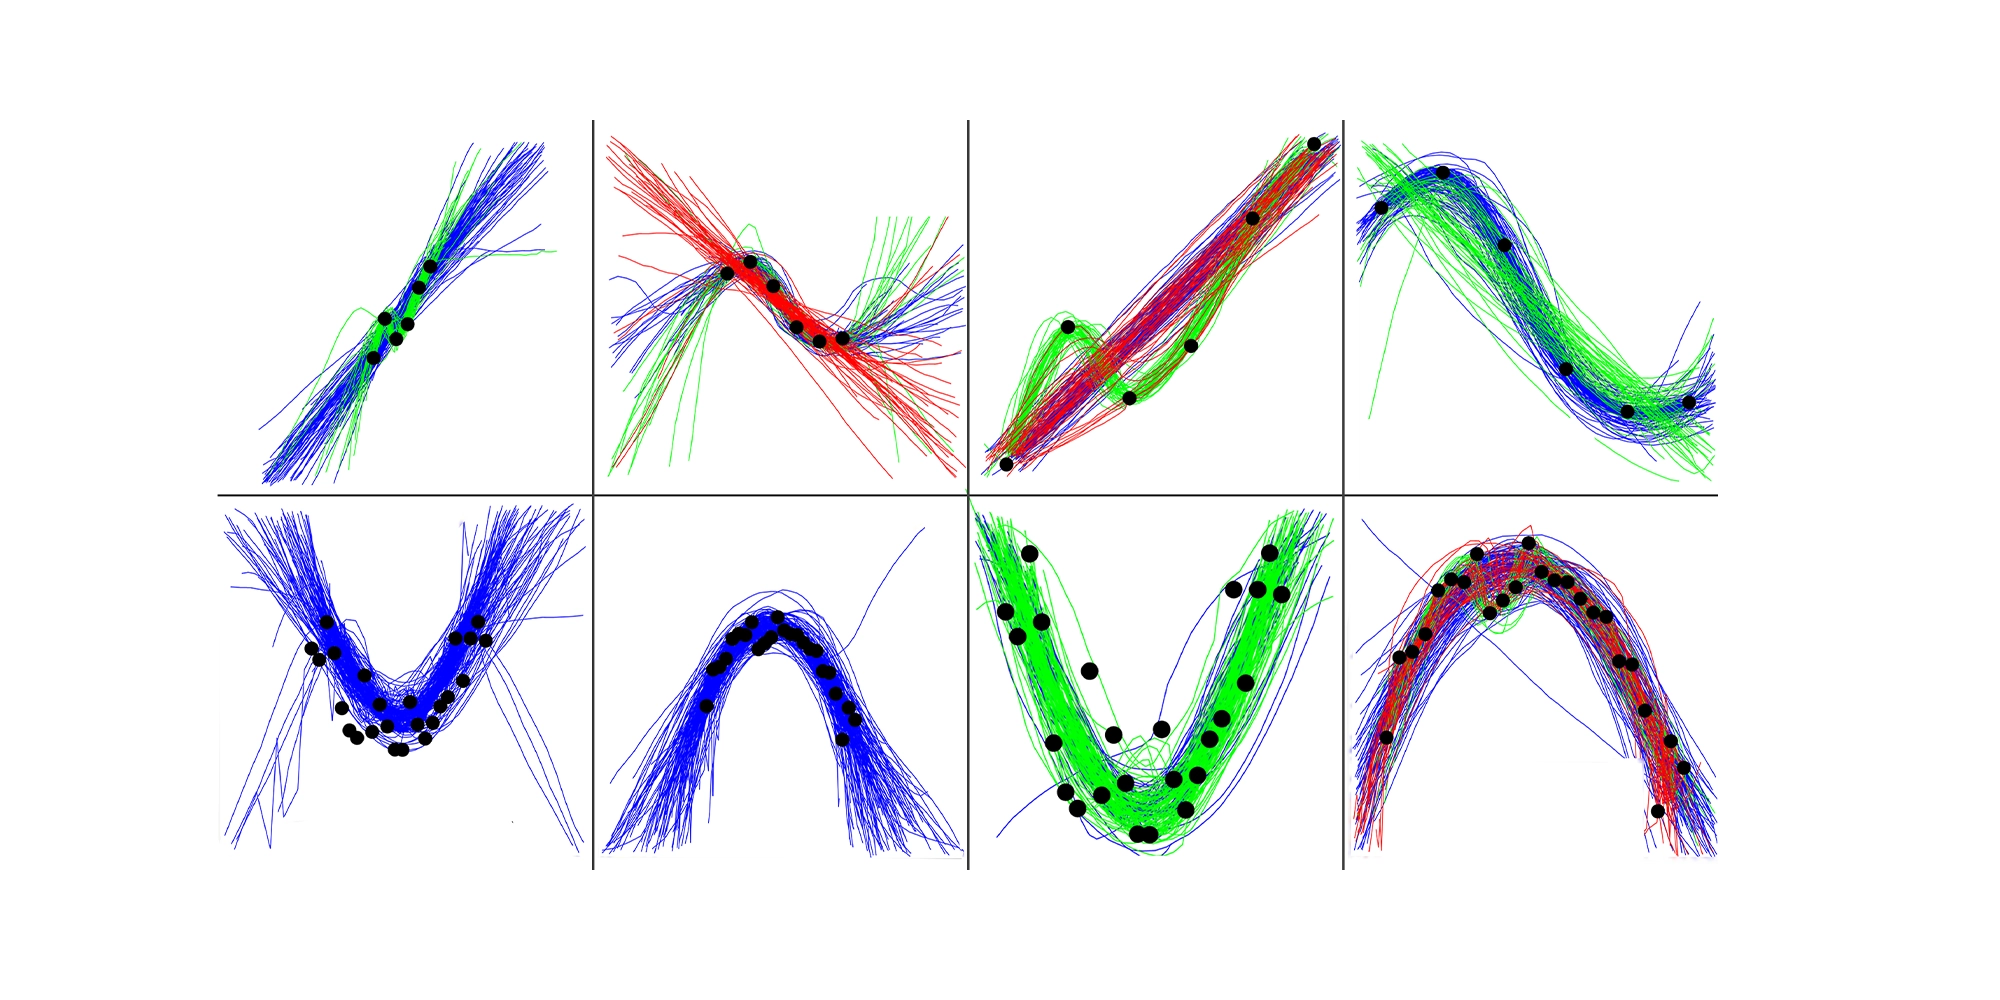
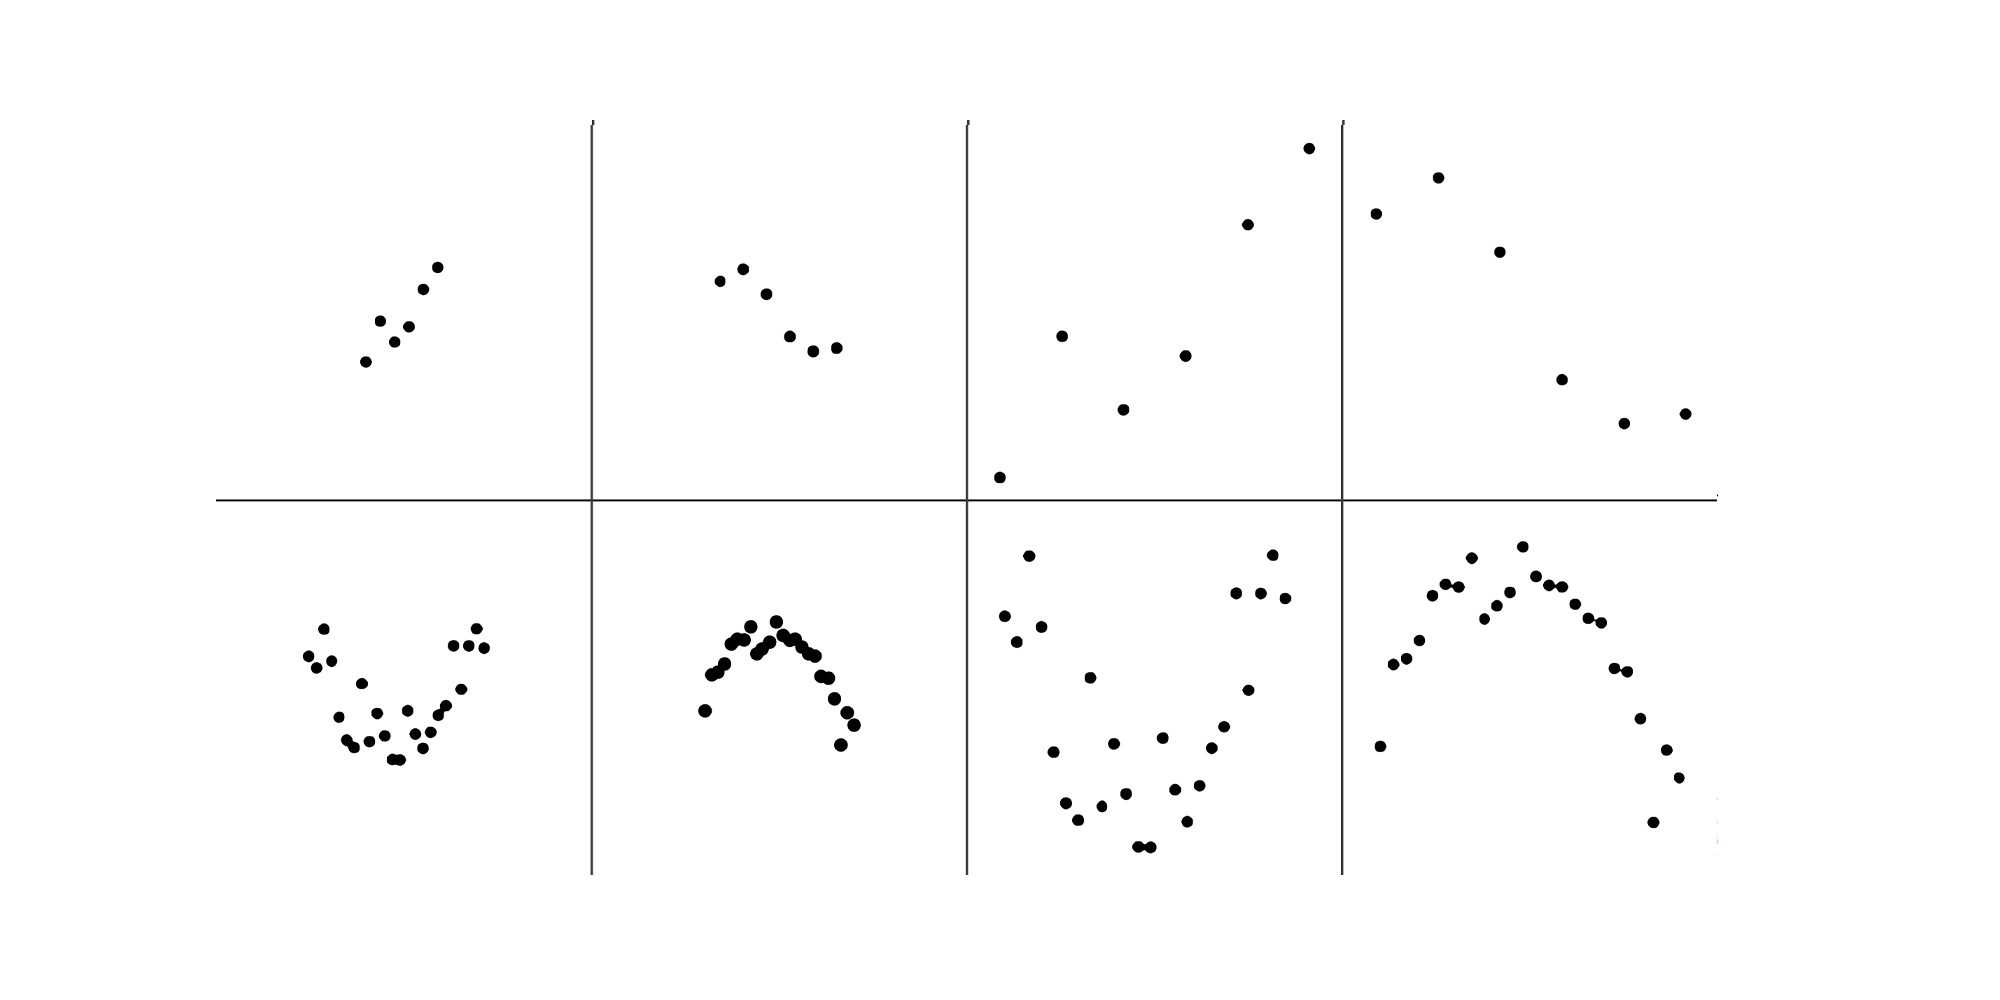
Students were asked to draw lines through scatterplots. Use the slider to see the results. Pictures: Supplied
Our research found several interesting things. Some people drew lines which were approximately polynomial mathematical functions, following the global trends in the data.
Others generated functions that tracked the local changes in the dots, moving up and down with each data point.
But this tendency to ‘see’ more of a local pattern was more pronounced when there were fewer data points.
To understand the different types of functions people drew, we used a statistical clustering technique to group functions which came from the same family. We identified three different types: linear functions, quadratic functions, and what we’ve called ‘data-tracking’ functions.
The linear and quadratic functions, define a simple relationship between all of the points in the graph – a global trend where the user prioritised simplicity over fit.

Health & Medicine
The meaning in our stars
The ‘data-tracking’ functions are more complex in the sense that they have a higher polynomial degree (they have more bends), but describe a simple psychological idea:
Perceptually, nearby points in the graph form a contour (we join the dots with our mind) and,
Psychologically, fluctuations in the points are meaningful – not just noise.
What this all means is that the way we interpret graphs requires an interplay of the conceptual (so asking ourselves ‘what is this describing?’) and perceptual (‘what am I seeing?’).
It also tells us that not everyone ‘sees’ data in the same way – our visual biases and prior experience may make us see more signal in the noise than is statistically warranted.