
Sciences & Technology
Making Big Data deliver


Citizen scientists are key to a big data project that will identify where the bad air lurks in our cities
Published 11 October 2016
We know the health risks of smoking and can make an informed choice on whether to light up or not. But most of us know virtually nothing about the level of cancer-causing air pollution in our neighbourhoods. Like passive smokers, we are left unaware of the health risks.
But imagine if we had information showing that living in neighbourhood X gave a higher risk of lung cancer than living in neighbourhood Y? Would you live there, and would the authorities be allowed to get away with tolerating it?
This is exactly the sort of information that a group of University of Melbourne scientists and other advocates are working to provide, and they are calling on citizens to help them by wearing portable air quality monitors to capture air pollution information from all over the city.
“We have the technology in place for people to monitor the air they are breathing and send through the information to cloud-based databases. We can then correlate this data with information on where lung cancer rates are higher, where vehicle traffic is heavier and where industrial pollution is more concentrated,” says University of Melbourne computer scientist and Director of eResearch, Professor Richard Sinnott.
“But the challenge we face is getting enough people to help us – we need citizen scientists to engage.”
Every day Professor Sinnott rides his scooter to work from Melbourne’s southeastern suburbs wearing an air monitor around his neck. It is about the size of his hand and is linked to the GPS in his phone. He uses the AirBeam air monitor, but there are many out there. “I feel like a Swiss cow wearing a cowbell,” he jokes.
Sciences & Technology
Making Big Data deliver
But if enough people can be encouraged to join the project, Professor Sinnott will be able to create a real-time information map that will ring more than a cowbell on the risks we are taking by not monitoring our air quality more carefully. Once that data evidence is in place, the group believes it will encourage policy makers to address air pollution “hot spots” in Melbourne and other Australian cities where pollution can reach dangerous levels that shouldn’t be tolerated.
Clare Walter, an honorary Royal Melbourne Hospital respiratory researcher and former Peter MacCallum Cancer Centre oncology pharmacist, certainly didn’t tolerate the dangerous levels of fine particular matter outside her daughter’s childcare centre in inner Melbourne.
Tiny particles in the air of 2.5 microns or less (PM2.5) are carcinogenic. These particles are about 30 times smaller than the width of a human hair. Particularly dangerous is PM2.5 from burnt carbon such as diesel, petrol and coal fumes. When in 2014 Ms Walter had the air tested outside her childcare centre it came back with a PM2.5 three-month average of 11.4 microns per cubic metre, well above the Environmental Protection Agency’s threshold annual average of 8 microns/cubic metre.
Yet according to the 2012 annual data she had previously received from the EPA, there wasn’t a problem. The EPA’s nearest air monitoring site 3km away at Alphington had recorded the annual average at apparently just 6.8 microns/cubic metre. She moved.
“Although we have these air quality standards we really have no idea what the quality of air is like in your street and how it might vary with the time of day,” says Ms Walter who is one of the driving forces behind the initiative, which has brought together researchers, clinicians and institutes from around the country. The Victorian Comprehensive Cancer Centre, Peter MacCallum Cancer Centre, the University of Melbourne and the Royal Melbourne Hospital are all supporting the group’s National Air Quality and Health meetings that are raising awareness and support for initiatives such as the citizen science project.
The problem with current air monitoring is that the EPA relies heavily on a few static measuring sites when monitoring air quality in and around Melbourne, Geelong and the La Trobe Valley – at Alphington, Footscray, Geelong South, Morwell South, Morwell East, Traralgon, Moe and Churchill. It only has a few portable air monitors, at Box Hill, Brighton, Dandenong, Mooroolbark, Altona, North Melton, Point Cook, Macleod, and Wangaratta.

While it is logical to assume that air pollution hot spots will be located near busy highways and in areas of heavy truck traffic, we simply don’t have the kind of definitive regular monitoring in place to highlight where the bad the air is, says Professor Sinnott. And neither has anyone, until now, tried to correlate this information with where lung cancer is actually occurring.
“Through big data platforms such as the Australian Urban Research Infrastructure Network based at the University of Melbourne, we now have the ability to combine heterogeneous data sets including cancer data, pollution data, traffic data and weather data,” says Professor Sinnott.
He says AURIN already has the storage and computing power to handle the massive amounts of data a citizen-led monitoring initiative would generate. AURIN uses a distributed cloud computing platform that uses big data processing algorithms akin to the systems used by Google and Facebook.
“We have access to plenty of data storage, we have all the software engineers to do it, but what we need is for citizens to engage and for the agencies to work with us,” says Professor Sinnott, who has already had the AirBeams benchmarked against the EPA’s official pollution sensor machines to ensure they are accurate.
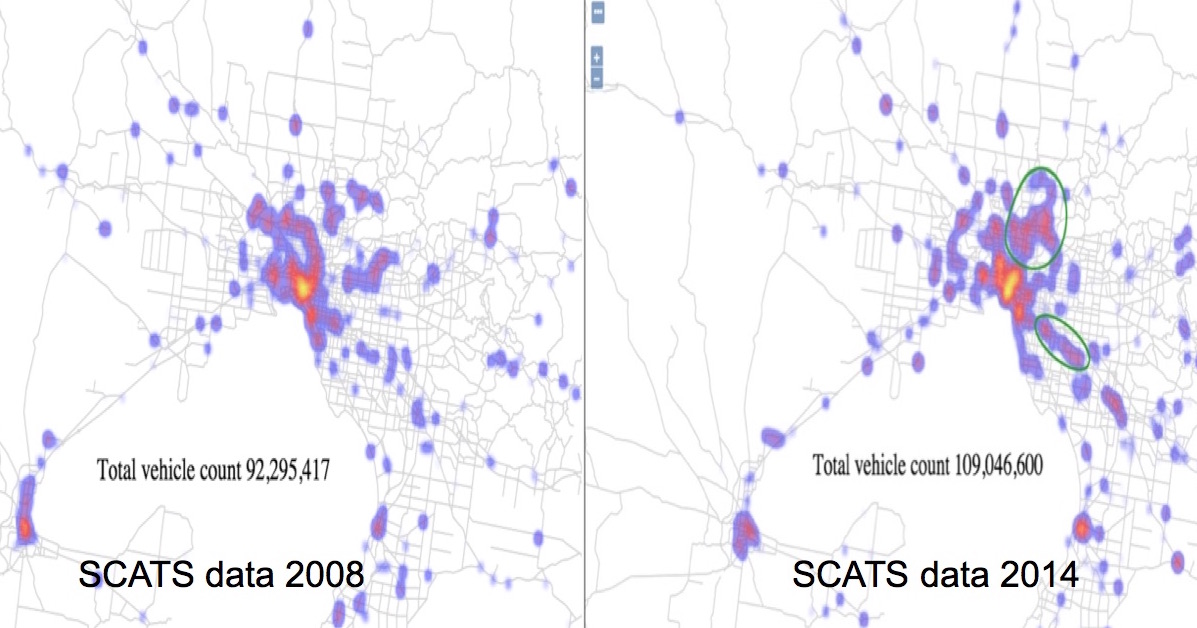
Professor Sinnott is now lobbying to get access to the live feed of data from the EPA’s sites. He also wants live information from VicRoads on traffic volumes recorded on its network of 11,000 SCATS monitoring sites – these are the black bands on the road we drive over. The aim is to combine this with the citizen science data and correlate it with current public information on lung cancer and smoking rates in each postcode, air pollution data reported from industry, and weather information.
Professor Sinnott is pursuing the work as part of the Clean Air and Urban Landscapes Clean Air and Urban Landscapes Hub, funded under the National Environmental Science Programme, that brings together researchers from the University of Melbourne, RMIT, the University of Wollongong, and the University of Western Australia. It is led by University of Melbourne atmospheric scientist Professor Peter Rayner.
A potential hurdle on the citizen science initiative is persuading enough participants to fork out $200 or so to buy the devices, which is why he is campaigning to get sponsorship and raise awareness of the technical solutions that are now available.
Lung cancer is the leading cause of cancer death in Australia and only 15 per cent of sufferers survive beyond five years of diagnosis. But while smoking has been a leading cause of lung cancer, clinicians are concerned at the growing number of sufferers who have never smoked. Ms Walter says that about 20 per cent of people diagnosed in Australia with adenocarcinoma lung cancer have never smoked, putting the spotlight on other potential causes such as air pollution.
The World Health Organization estimates that outside air pollution caused 3.7 million deaths in 2012. PM2.5 is a class 1 carcinogen, meaning there is no doubt that it is a cause of cancer. WHO also estimates that air pollution causes 25 per cent of lung cancer deaths, and there is evidence that diesel engine pollution can even cause DNA damage and mutations in sperm cells. A meta-analysis of previous research suggests that every 10 micron/cubic metre increase in PM2.5 is correlated to a 40 per cent increase in the lifetime risk of developing lung cancer. Another meta-analysis has suggested there is a significant increased risk of lung cancer among people living within 100 metres of a major road.
For Ms Walter, a big part of the project is to generate awareness of the issue and encourage people to start taking an interest in the air they breathe.
“The Australian public is very much in the dark about air quality and a project like this can only give us better information and make people more aware of the issue. That can then flow through to better policy protections,” she says, such as better monitoring, heavier enforcement of standards, and action to reduce air pollution at peak times and in peak areas.
“Years ago it was considered fine to light a cigarette at a table next to one where young children were sitting, yet no one would dream of doing that now. But today we have people outside schools idling their cars blowing out exhaust, and that is just as inconsiderate health-wise, but we tolerate it,” says Ms Walter.
Information on how to particpate in the project can be found here.
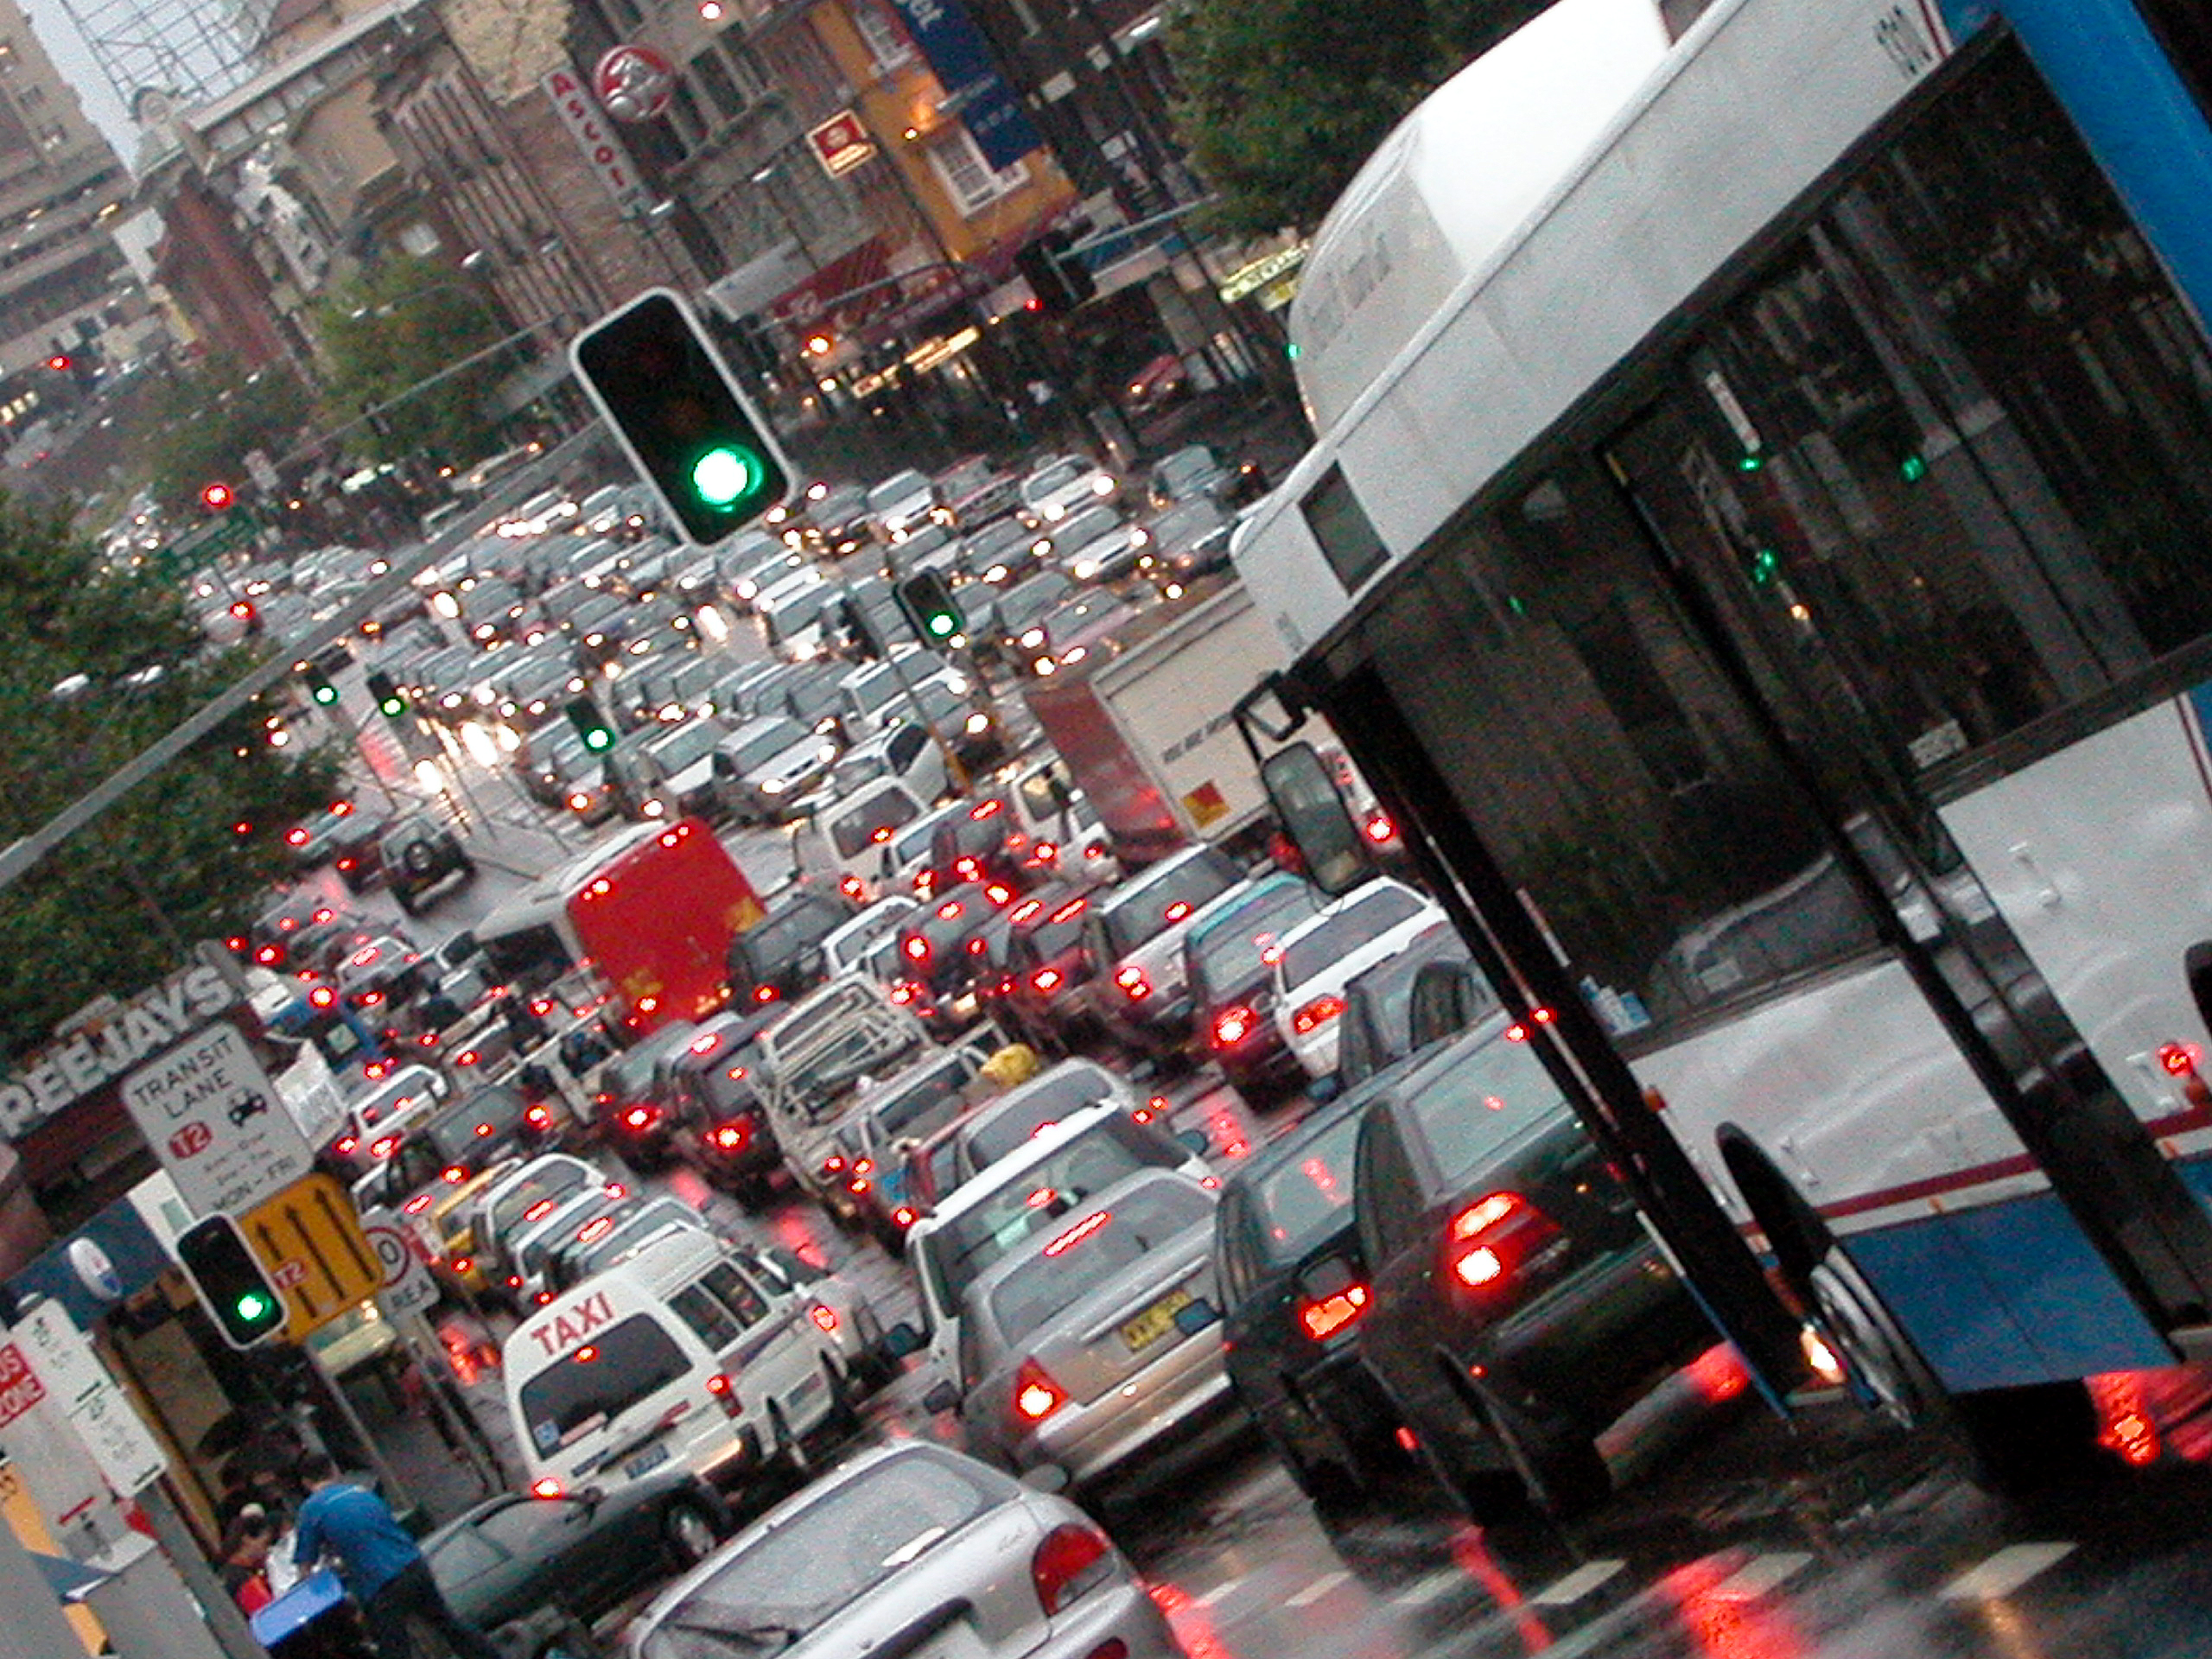
Banner Image: Traffic jam in Sydney by Jeff Overs/Getty Images

