
Sciences & Technology
Forecasting landslides from space
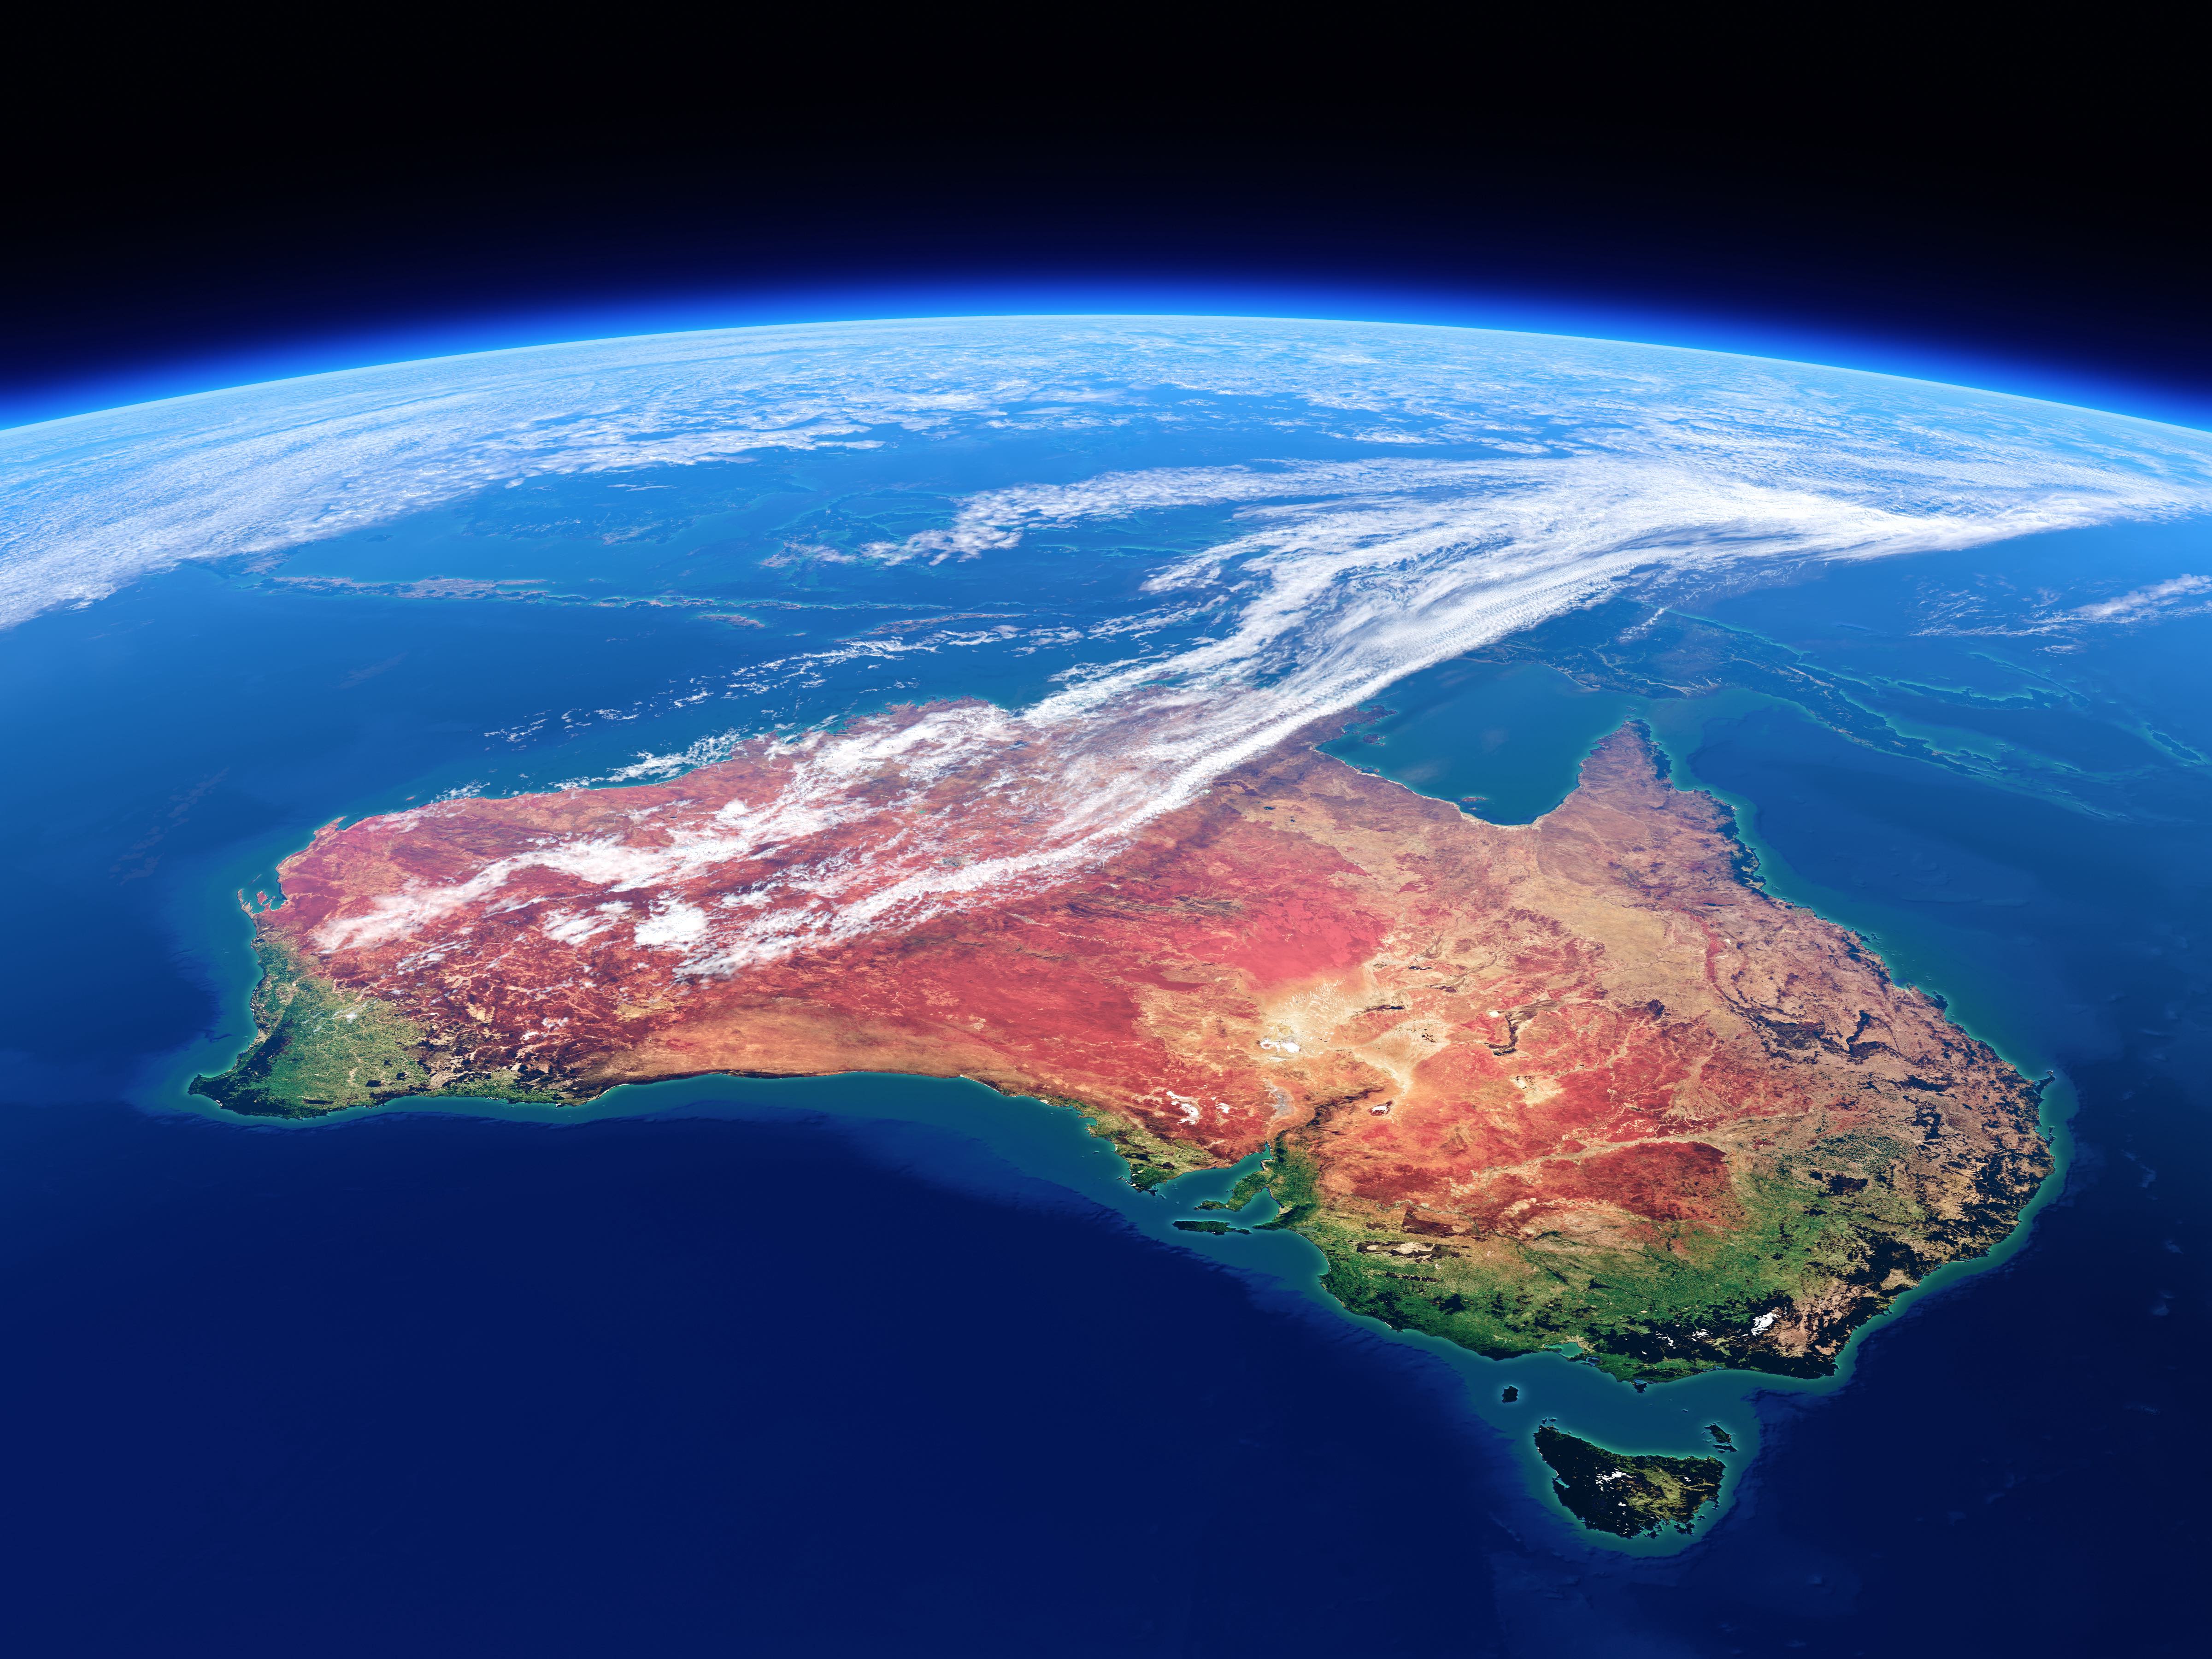
New research is combining data from satellites to help us better anticipate and adapt to climate change and extreme weather in Australia
Published 5 December 2022
For decades, satellites have been keeping a watchful eye on Earth, relaying increasingly precise, detailed and timelier information than ever before.
Armed with the right mathematical tools, we can use this information to anticipate and mitigate climate extremes and associated hazards – from floods to landslides.
So why isn’t this happening now?
To harness its full potential, we need algorithms that can process this complex and diverse mix of big data from different satellites – en masse and quickly.
This has been easier said than done, but we have found a way.
In our research, published in GIScience & Remote Sensing, our team combined the best satellite precipitation data sources together with rain gauge measurements to deliver a comprehensive rainfall map of Australia.

Sciences & Technology
Forecasting landslides from space
Our Precipitation Profiler-Observation Fusion and Estimation tool – known as PProFUSE – is a first-of-its-kind tool that blends data from multi-satellite global remote sensing, taking full advantage of the Bureau of Meteorology’s (BoM) national rain gauge network to build our map.
The tool brings together this precipitation information to generate one unified data set that is more consistent, more accurate and more useful than any other available data sources in Australia.
A reliable and spatially comprehensive map of precipitation for the entire Australian continent is crucial for research and policymaking in the face of changing climate extremes and variability.
To meet this critical need, we require reliable estimates of precipitation from different sources, integrated into one data set. Currently, Australia relies on accurate precipitation measurements from BoM’s rain gauges, but this covers only a tiny fraction of the continent.
Australia is huge. It stretches across an area of 7.62 million square kilometres, but around 90 per cent of Australians live in just 0.22 per cent of this landmass.
This means several million square kilometres of Australia’s land and oceans are in urgent need of reliable rainfall estimates. Satellite precipitation data sources can provide this continuously at adequate temporal and spatial resolution with broad coverage.
The only problem is that each source comes with its own errors and biases that depend on the location where the estimate is needed. PProFusE aims to optimally fuse the advantages of different data sources to come up with the best estimate of precipitation across all of Australia.

Health & Medicine
Using mathematics to treat malaria
We examined different remotely sensed precipitation data sources and found the US National Oceanographic and Atmospheric Administration’s (NOAA) Climate Prediction Center morphing technique (CMORPH) and the Japan Aerospace Exploration Agency’s (JAXA) Global Satellite Mapping of Precipitation (GSMaP) to provide the best estimates of precipitation of Australia.
Fusing data from the indirect measurements from CMORPH and GSMaP together with BoM’s direct measurements from rain gauges combines the best of three worlds into one.
In locations that do have gauges, PProFusE returns a precipitation estimate that’s exactly equal to the direct and trusted gauge measurements from BoM. In ungauged locations, PProFusE delivers an optimal estimate of precipitation.
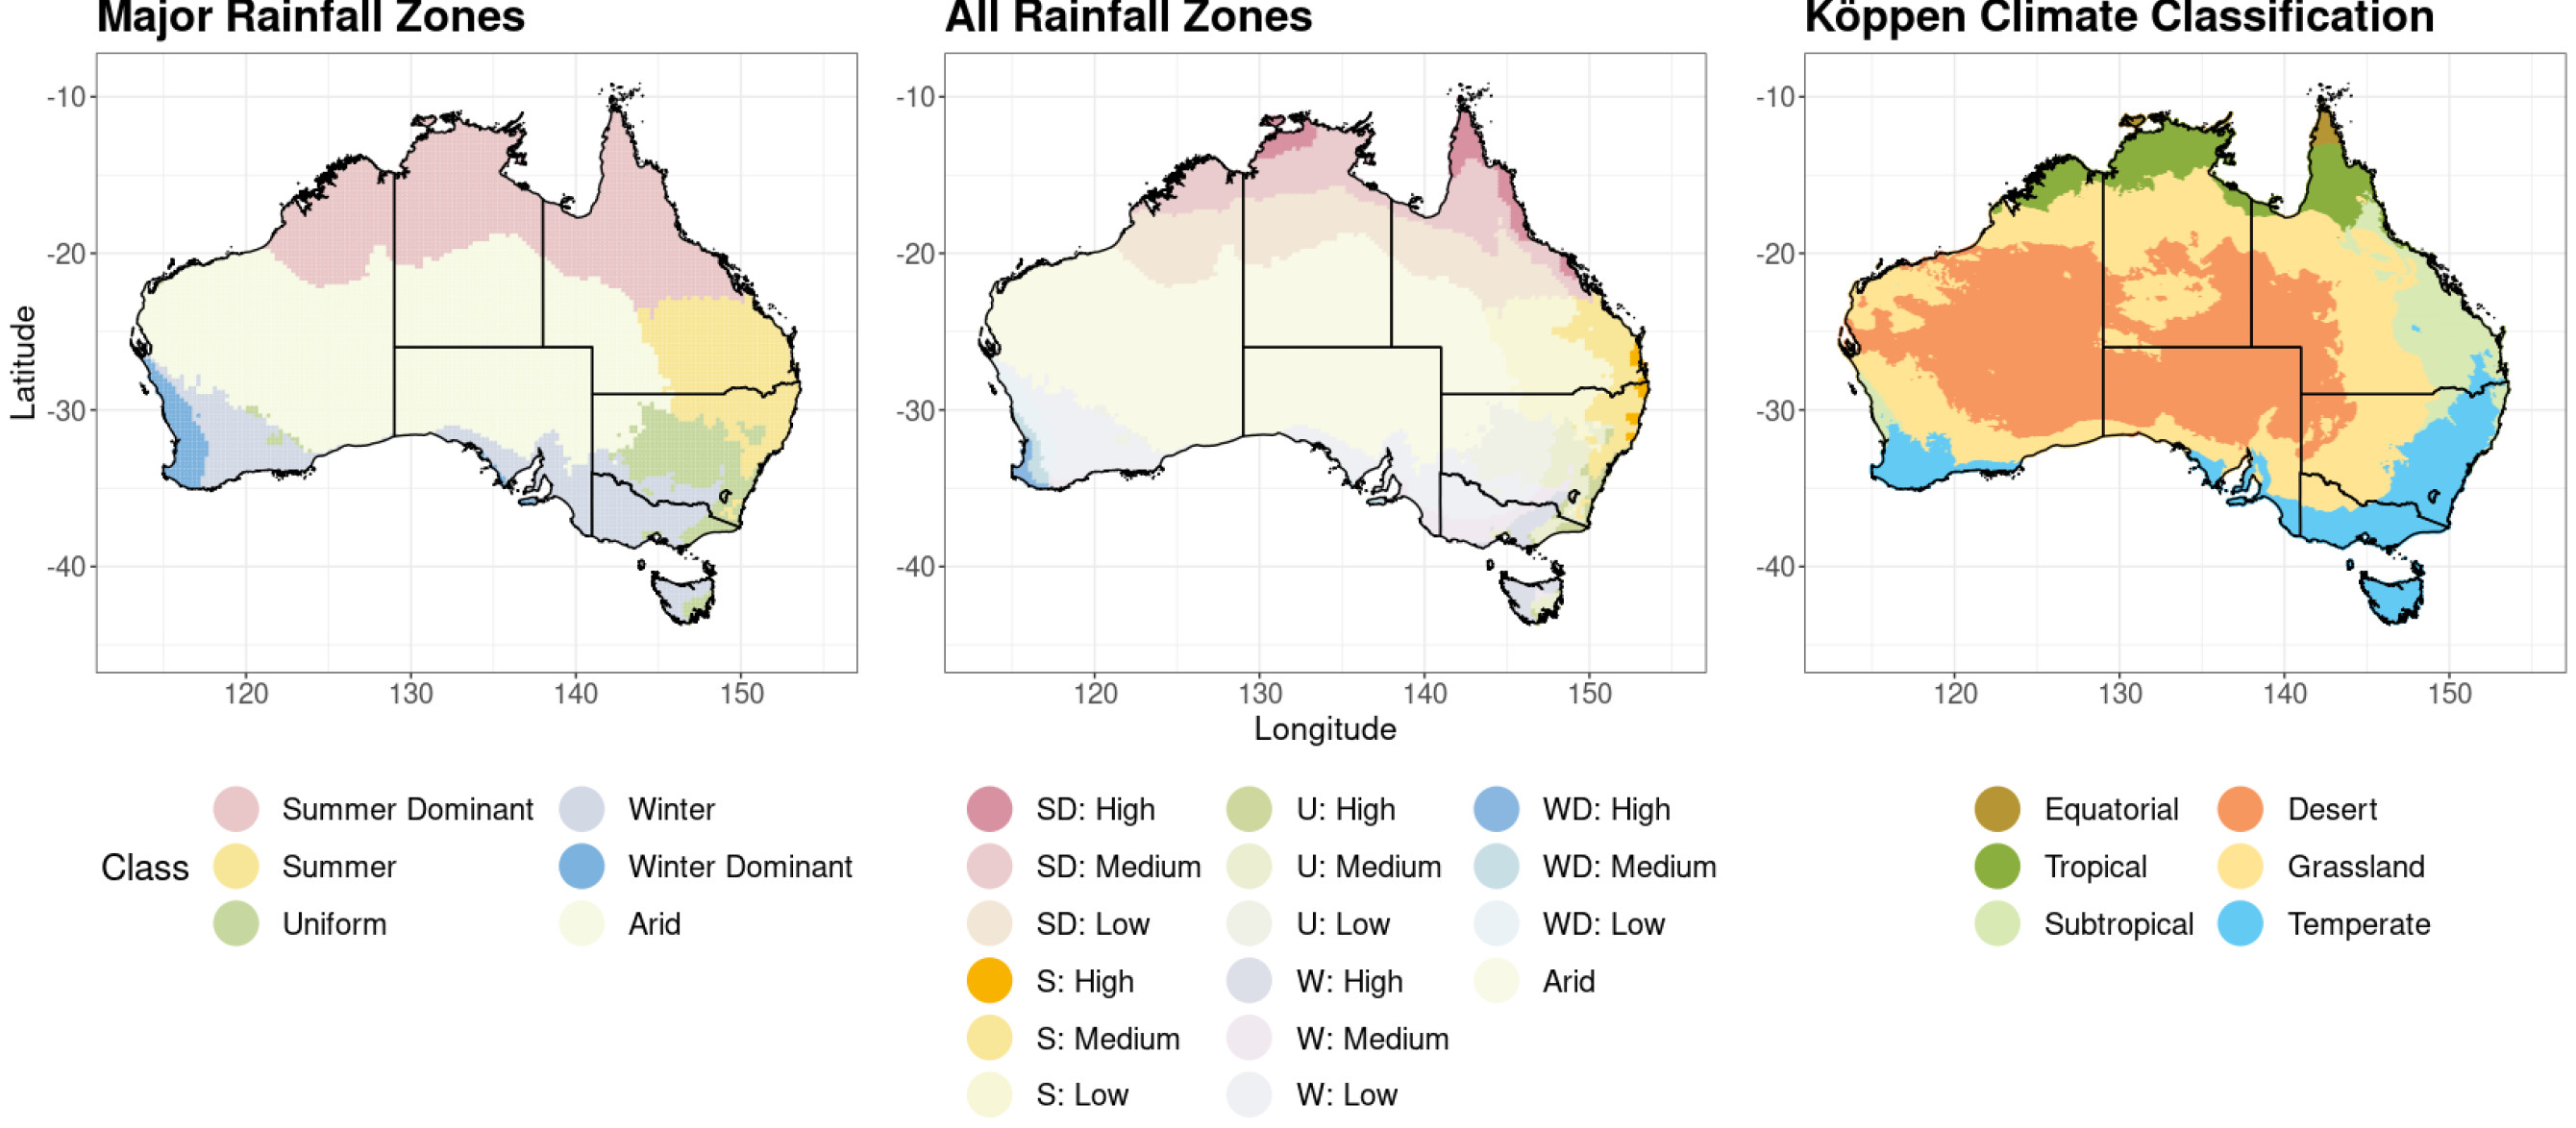
The data we have collated suggests a new normal for Australia’s climate zones.
Our study compared Australia’s precipitation from the fused satellite data over the past two decades with the BoM’s climate zones classification map, which shows the six major rainfall zones identified in the 20th Century.

Environment
Mapping climate policy
So, wet summers may become the new normal for much of the country. The wet summer dominant zone is now creeping towards the middle of the continent, stretching across Western Australia, Northern Territory and Western Queensland.
If we look at the recent floods across the east coast through the lens of our data we can see we’ll continue to see wetter summers and more flood events in these regions.
While some parts of Australia get wetter, other areas have seen a shift to more arid and drought-prone trends. Australia’s arid regions are shifting southwards into the country’s southern coastline towns – making all of South Australia essentially arid.
Arid climates can be dangerous and lead to environmental problems like those currently seen in South Australia’s Fowlers Bay which is being slowly buried by encroaching sand dunes due to its desert-like climate.
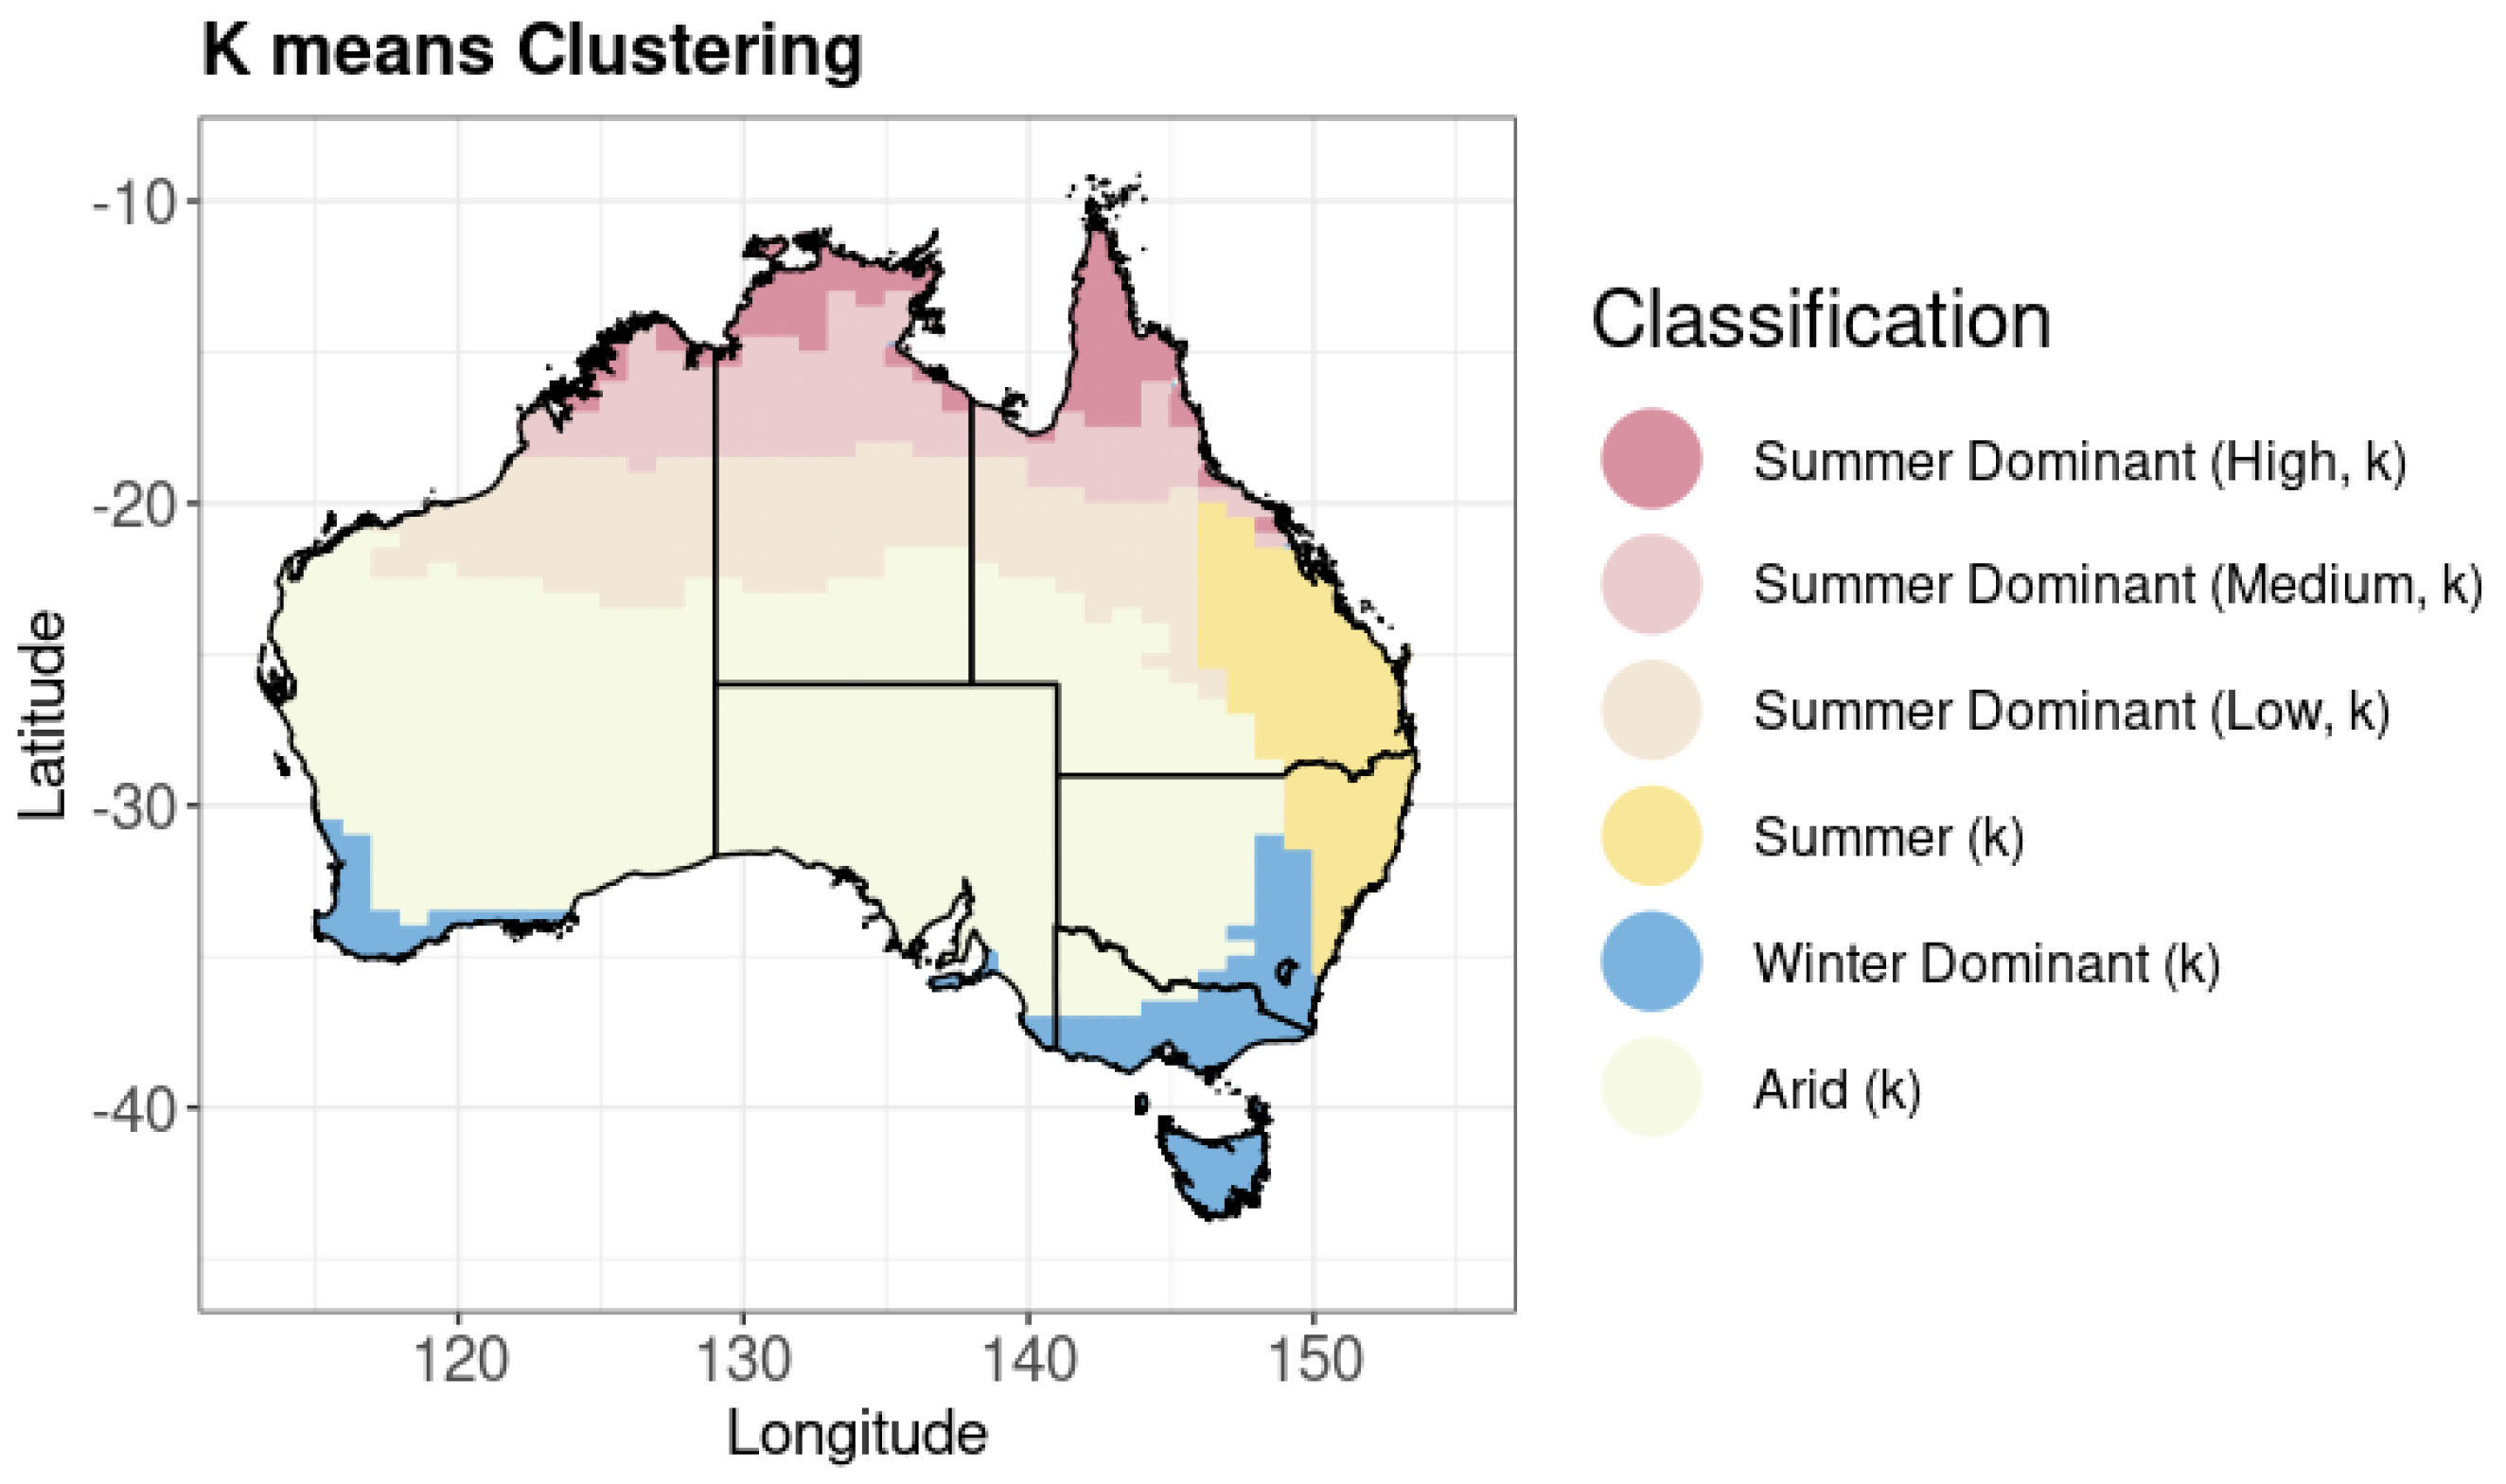
These opposing climate extremes mean Australia is losing its Mediterranean climate zones – those hot, dry summers and cool, wet winters.
Australia’s rain gauges do not capture the full picture of our changing climate and variabilities.

Sciences & Technology
Tech can do a lot, but won’t get us to net zero on its own
To properly understand and anticipate Australia’s changing climate and emerging extremes, we need to track rainfall patterns throughout the entire continent - not just our coastlines where the current rain gauges are located.
We are now working to develop a series of tools that turn our map into near real-time, data-driven rainfall forecasting and what-if-scenario analytics. Our work on PProFUSE compliments BoM’s rainfall data and can help with climate-risk-informed decision-making and policy.
In real terms, this information can benefit many.
The risks of changing climate extremes are great and impact essentially all that matters to everyday Australians – from our food, water, health and energy security, to infrastructure, ecosystems, transport, insurance and tourism.
Now that we have good-quality data for the whole of Australia, we can use the information to generate data-driven forecasts alongside BoM.
All Australians are seeing the enormous damage that our changing climate patterns can inflict on communities across the country, not to mention the impact on our economy and environment.
Our PProFUSE tool can help industry and government put climate data to work for the public good of Australia.
Banner: Getty Images