Health & Medicine
Cleaner safe air needs you!


Australia’s AURIN platform is a unique computing resource making sense of the masses of data researchers are now dealing with.
Published 25 October 2016
Researchers at the world-famous Peter MacCallum Cancer Centre in Melbourne recently had a medical conundrum that couldn’t be solved in a test tube or at a lab bench.
Why, they wanted to know, were an increasing number of patients – about a third of them women – being diagnosed with certain types of lung cancer when none of them had smoked and their families had no history of cancer?
And why were they showing up in clusters in different parts of Victoria?
To find the answer, these specialists turned to scientists offering innovations in capturing, analysing and visualising diverse data sets through so-called big data analytics.
Leveraging the Australian Urban Research Infrastructure Network (AURIN) platform – developed through a national co-operative effort led by the University of Melbourne – the Peter MacCallum scientists were able to draw on detailed data from a wide range of sources and combine it with their own lung cancer data.

This information included data on car pollution on Victoria’s roads, factory pollution through the National Pollutant Inventory, weather data from the Bureau of Meteorology and population data from the Australian Census.
Professor Richard Sinnott, Director of eResearch at the University and Professor of Applied Computing Systems in Computing and Information Systems in the Melbourne School of Engineering, led the team that built the AURIN platform, which commenced in 2010.
“We aimed to build a system for urban and built environment researchers across Australia to provide access to definitive data,” he says. “So, if you were interested in crime in Melbourne, you would ask Victoria Police.
Health & Medicine
Cleaner safe air needs you!
“Or if your interest was in alcohol consumption in Perth, you’d go to an organisation that recorded who sold alcohol and how much, and so on. Many agencies have definitive data sets related to urban settlement but they are fragmented and usually not immediately ready for researchers to begin their analysis.
“The AURIN platform interacts with all of them on the researcher’s behalf and, accessing their data directly, presents it in an easily searchable format and prepares it for immediate analysis.”
AURIN’s platform, believed to be unmatched in the world, allows seamless and secure access to data from the definitive organisations of Australia. This data can be combined, compared and visualised through maps and charts that can show relationships that might otherwise be missed.
This was done with the lung cancer patients at the Peter MacCallum Cancer centre. Maps showed the highest rates of cancer occurrence were in the north and west of Melbourne, near Geelong and in the Latrobe Valley.
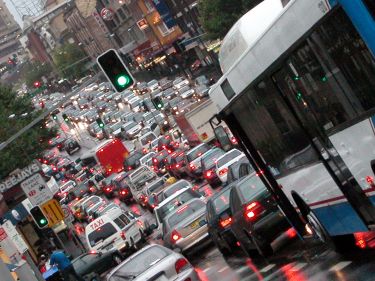
“The doctors believe some of these cancers are related to where these people live – Yarraville, for example, where big lorries are constantly passing, emitting pollution from their engines,” Professor Sinnott says. “But there is no way of saying precisely that is the reason; there are so many potential causes of air pollution.”
AURIN has access through the National Pollutant Inventory to data from regular audits made of companies that hold licences to pollute. AURIN also knows from the state traffic authority, VicRoads, how many cars and trucks are travelling on which roads. “But it is not real time data,” says Professor Sinnott.
“The Environment Protection Authority has several locations around Melbourne where they measure pollution very accurately, but they have no way of telling you right now what the level of pollution is on a certain street and how it might have changed over the day.”
His answer was to buy a batch of small mobile pollution recorders that can be used by people living in Yarraville, Newport and other places likely to have pollution events.
Generally Melbourne’s air is reasonably clear, he says, but the relationship between air pollution and cancer has been shown to be linear. “Less pollution may mean less risk, but there is always risk.
So when people are considering whether to build another freeway or another train station, it is factors such as these that should be considered in terms of the bigger story.
“This is really what AURIN is about, from my perspective,” Professor Sinnott says. “It is about growing the kinds of systems that allow us to answer these more complicated stories. The doctors at Peter MacCallum have no idea how many cars are on the roads in Victoria right now, and the people who build roads have no idea of their effect on health.
“The people who fund the infrastructure, license the factories and oil refineries, have no idea how their data compares with everyone else’s data – the pollution and health data, the number of people living in that vicinity, the lack of green space and what is happening to it through the continual building of yet more housing estates.

“It is the longer term consequences of these decisions that people need to start understanding. Right now they are not because there is no way to measure, understand and quantify – to recognise that all these things are connected. That is really what AURIN is trying to do. There must be a balance, but as things stand that balance is being destroyed.”
The Peter MacCallum Cancer Centre project is just one example of how researchers are working with AURIN. Monitoring the 10,000 square kilometres of Melbourne’s sprawling metropolis is another. As Australia’s cities change and grow, the resilience of their communities and infrastructure is increasingly tested.
Specialists such as the City of Melbourne’s chief resilience officer, Toby Kent, find AURIN’s detailed, layered mapping a valuable tool for observing these changes and planning to deal with them.
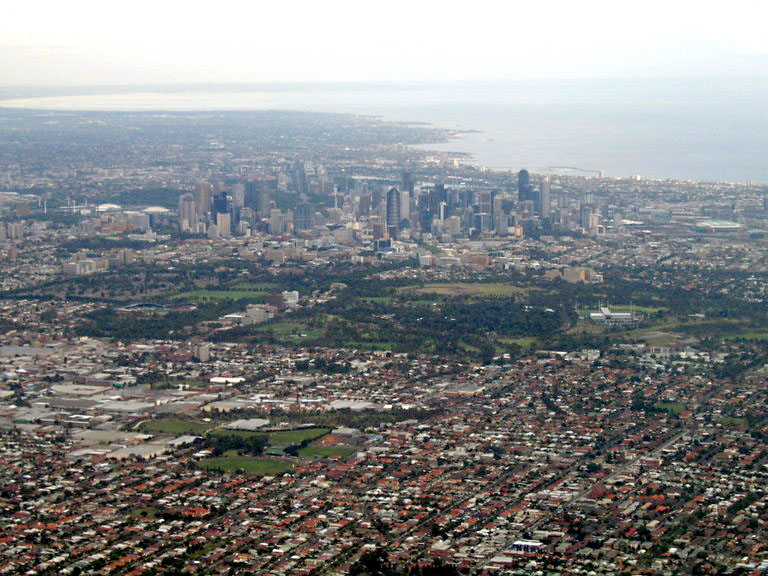
“Our role is (to determine) how to prepare the city so that it is better able to deal with the stresses and the shocks that will come our way,” Mr Kent says. The fine detail available on AURIN’s multilayered maps is invaluable in that process.
“Its value is in ensuring that we make decisions based on the reality of what is there rather than perceptions,” he says. “We use AURIN’s maps to understand where there is disadvantage, for example, which is very important in our strategy.
“People are at the heart of all cities, but that does not exclude the built environment. We have four things that we talk about: viability, sustainability, livability and prosperity. We use AURIN’s maps to understand where there is disadvantage.”
Using AURIN, his team has been focusing on enhancing social cohesion, creating spaces that are more inclusive, and considering how best to create diverse local employment opportunities. “The maps and the data sets that AURIN provides have been enabling us to both understand those situations and make the case for action.”
For example, they have used data gathered for AURIN’s maps to highlight the correlation between obesity and economic prosperity, or lack of it, and where it occurs. Another study looks at community vulnerability relating to heat and green space.
Mark Stevenson, the Professor of Urban Transport and Public Health in the School of Population and Global Health at the University of Melbourne, says AURIN is unique. An epidemiologist who was formerly director of the Monash Accident Research Centre, he is using AURIN data to study the effect of urban design and transport on resident and city health.

“The data that AURIN provides in many, many layers allows exploration of a whole array of complex relationships; just invaluable,” he says. “I am finding relationships that I hadn’t previously used or even considered.”
Part of his work is about land use and how it might figure in safer travel and better health outcomes – for example, through reduction of stress caused by delays on clogged highways. Transport, both public and private, is approaching a period of great change, he says, not least from the imminent arrival of autonomous cars, trucks and buses.
“AURIN is a very valuable tool for planning and thinking about what our cities will need as we move forward,” he says. “We can look through multiple lenses; that is the key to it.”
Professor Stevenson is also working with the State Government on road fatality rates. “The traditional approach would be to look at what are we doing and how effective it is. But when you have a whole array of opportunities and data to look at, it allows you to see other scenarios government could consider that would not only reduce road trauma but potentially have tremendous benefit for the city in the way it functions, not only in the transport mode, but also for peoples’ health, reduced emissions and so on.
Associate Professor Elizabeth Brooke, of Swinburne University of Technology, a specialist in the impact of an ageing population, has spent the past two years using AURIN’S data and technologies to map in close detail the problems faced by many elderly people.

Like other AURIN-based projects, her study covers a huge array of issues – from the availability and distribution of aged-care facilities to the incidence of isolation, loneliness, inadequate income, the need for help in home maintenance and the prospects for employment – all down to near-individual levels.
At the data helm of AURIN is geomatician Dr Serryn Eagleson, the network’s manager of data and analytics, who supervises the ever-changing information in the network. Some data – for instance, that drawn from the census – lasts five years. “But some change daily – public transport usage for instance, ABN numbers and property values,” she says.
Dr Eagleson joined AURIN in 2014 but has worked in the geospatial field for 17 years, since graduating from the University of Melbourne. AURIN, she says, is unique and fascinating. “There are similar portals elsewhere in the world, but AURIN is the only one so far to put everything together.”
The AURIN contains a number of access points a freely available viewer of research insights is available from map.aurin.org.au.
Academic users can log in to the AURIN Portal for research purposes with their own existing institutional username/password. For more information at AURIN and to access the data rich analytical world it offers log in to the portal. Non-academics – for example, those in government – can use the systems, however an account has to be set up by the AURIN team.
See here for details on how to apply for an account.
Banner Image: Thomas Trutschel/Getty Images


